US6810291B2 - Scalable, hierarchical control for complex processes - Google Patents
Scalable, hierarchical control for complex processes Download PDFInfo
- Publication number
- US6810291B2 US6810291B2 US10/243,963 US24396302A US6810291B2 US 6810291 B2 US6810291 B2 US 6810291B2 US 24396302 A US24396302 A US 24396302A US 6810291 B2 US6810291 B2 US 6810291B2
- Authority
- US
- United States
- Prior art keywords
- sub
- metric
- metrics
- target
- values
- Prior art date
- Legal status (The legal status is an assumption and is not a legal conclusion. Google has not performed a legal analysis and makes no representation as to the accuracy of the status listed.)
- Expired - Fee Related, expires
Links
- 238000000034 method Methods 0.000 title claims abstract description 796
- 230000008569 process Effects 0.000 title claims abstract description 267
- 238000005457 optimization Methods 0.000 claims abstract description 65
- 238000012545 processing Methods 0.000 claims description 26
- 238000004519 manufacturing process Methods 0.000 claims description 25
- 230000009471 action Effects 0.000 claims description 2
- 230000006870 function Effects 0.000 description 44
- 239000013598 vector Substances 0.000 description 42
- 238000001465 metallisation Methods 0.000 description 26
- 235000012431 wafers Nutrition 0.000 description 23
- 238000012549 training Methods 0.000 description 17
- 238000013528 artificial neural network Methods 0.000 description 13
- 239000002184 metal Substances 0.000 description 13
- 238000012937 correction Methods 0.000 description 9
- 238000012417 linear regression Methods 0.000 description 7
- 238000005192 partition Methods 0.000 description 7
- 230000008859 change Effects 0.000 description 6
- 238000000151 deposition Methods 0.000 description 6
- 230000004044 response Effects 0.000 description 6
- 238000004422 calculation algorithm Methods 0.000 description 4
- 230000008021 deposition Effects 0.000 description 4
- 238000010586 diagram Methods 0.000 description 4
- 230000000694 effects Effects 0.000 description 4
- 238000001459 lithography Methods 0.000 description 4
- 238000005259 measurement Methods 0.000 description 4
- 210000002569 neuron Anatomy 0.000 description 4
- 230000003287 optical effect Effects 0.000 description 4
- 229920002120 photoresistant polymer Polymers 0.000 description 4
- XUIMIQQOPSSXEZ-UHFFFAOYSA-N Silicon Chemical compound [Si] XUIMIQQOPSSXEZ-UHFFFAOYSA-N 0.000 description 3
- 238000013459 approach Methods 0.000 description 3
- 238000004891 communication Methods 0.000 description 3
- 238000004886 process control Methods 0.000 description 3
- 229910052710 silicon Inorganic materials 0.000 description 3
- 239000010703 silicon Substances 0.000 description 3
- 239000000126 substance Substances 0.000 description 3
- 238000012360 testing method Methods 0.000 description 3
- 230000000007 visual effect Effects 0.000 description 3
- 101100023111 Schizosaccharomyces pombe (strain 972 / ATCC 24843) mfc1 gene Proteins 0.000 description 2
- 230000008901 benefit Effects 0.000 description 2
- 238000004364 calculation method Methods 0.000 description 2
- 230000002068 genetic effect Effects 0.000 description 2
- 238000012423 maintenance Methods 0.000 description 2
- 230000007257 malfunction Effects 0.000 description 2
- 238000003062 neural network model Methods 0.000 description 2
- 238000000623 plasma-assisted chemical vapour deposition Methods 0.000 description 2
- 238000007781 pre-processing Methods 0.000 description 2
- 239000002002 slurry Substances 0.000 description 2
- 230000003044 adaptive effect Effects 0.000 description 1
- 230000015572 biosynthetic process Effects 0.000 description 1
- 230000009194 climbing Effects 0.000 description 1
- 230000000295 complement effect Effects 0.000 description 1
- 238000010276 construction Methods 0.000 description 1
- 230000002596 correlated effect Effects 0.000 description 1
- 238000001514 detection method Methods 0.000 description 1
- 238000011156 evaluation Methods 0.000 description 1
- 238000011066 ex-situ storage Methods 0.000 description 1
- 230000006872 improvement Effects 0.000 description 1
- 238000011065 in-situ storage Methods 0.000 description 1
- 230000003993 interaction Effects 0.000 description 1
- 239000000463 material Substances 0.000 description 1
- 239000011159 matrix material Substances 0.000 description 1
- 230000007246 mechanism Effects 0.000 description 1
- 238000004377 microelectronic Methods 0.000 description 1
- 230000004048 modification Effects 0.000 description 1
- 238000012986 modification Methods 0.000 description 1
- 230000008447 perception Effects 0.000 description 1
- 238000005504 petroleum refining Methods 0.000 description 1
- 238000001020 plasma etching Methods 0.000 description 1
- 238000005498 polishing Methods 0.000 description 1
- 230000009467 reduction Effects 0.000 description 1
- 230000008439 repair process Effects 0.000 description 1
- 230000035945 sensitivity Effects 0.000 description 1
- 238000000638 solvent extraction Methods 0.000 description 1
- 238000004544 sputter deposition Methods 0.000 description 1
Images


Classifications
-
- G—PHYSICS
- G05—CONTROLLING; REGULATING
- G05B—CONTROL OR REGULATING SYSTEMS IN GENERAL; FUNCTIONAL ELEMENTS OF SUCH SYSTEMS; MONITORING OR TESTING ARRANGEMENTS FOR SUCH SYSTEMS OR ELEMENTS
- G05B13/00—Adaptive control systems, i.e. systems automatically adjusting themselves to have a performance which is optimum according to some preassigned criterion
- G05B13/02—Adaptive control systems, i.e. systems automatically adjusting themselves to have a performance which is optimum according to some preassigned criterion electric
- G05B13/0265—Adaptive control systems, i.e. systems automatically adjusting themselves to have a performance which is optimum according to some preassigned criterion electric the criterion being a learning criterion
- G05B13/027—Adaptive control systems, i.e. systems automatically adjusting themselves to have a performance which is optimum according to some preassigned criterion electric the criterion being a learning criterion using neural networks only
Definitions
- the invention relates to the field of data processing and process control.
- the invention relates to nonlinear regression prediction and/or control of complex multi-step processes.
- Process prediction and control is crucial to optimizing the outcome of complex multi-step production processes.
- the production process for integrated circuits comprises hundreds of process steps (i.e., sub-processes).
- each process step may have several controllable parameters, or inputs, that affect the outcome of the process step, subsequent process steps, and/or the process as a whole.
- the impact of the controllable parameters on outcome may vary from process run to process run, day to day, or hour to hour.
- the typical integrated circuit fabrication process thus has a thousand or more controllable inputs, any number of which may be cross-correlated and have a time-varying, nonlinear relationship with the process outcome.
- process prediction and control is crucial to optimizing process parameters and to obtaining, or maintaining, acceptable outcomes.
- the present invention provides a method and system for complex process prediction and optimization utilizing sub-process metrics and optimization of the sub-process metrics with respect to a cost function for the process.
- the invention comprises: (1) providing a map between the sub-process metrics and process metrics using a nonlinear regression model; (2) providing one or more target process metrics; (3) providing an acceptable range of values for the sub-process metrics to define a sub-process metric constraint set; (4) providing a cost function for the sub-process metrics; and (5) determining values for the sub-process metrics that are within the constraint set, and that produce at the lowest cost a process metric(s) that is as close as possible to the target process metric(s) in order to define target sub-process metrics for each sub-process.
- steps (1) to (5) in the preceding paragraph are applied at different hierarchical process levels. For example these steps may be repeated for sub-sub-processes of one or more sub-processes. (That is, the sub-process becomes the “process” of steps (1) to (5) and the sub-sub-process becomes the “sub-process.”)
- steps (1) to (5) in the preceding paragraph are repeated for a higher level process composed of two or more processes from step (1). (That is, the process becomes the “sub-process” of the new higher level process.)
- the present invention may perform a hierarchical series of steps (1) to (5) that can be scaled to any level of the overall production process.
- metric refers to any parameter used to measure the outcome or quality of a process or sub-process. Metrics include parameters determined both in situ during the running of a sub-process or process, and ex situ, at the end of a sub-process or process.
- the map between sub-process metrics and process metrics is preferably determined by training a nonlinear regression model against measured sub-process and process metrics.
- the sub-process metrics from each of the sub-processes serve as the input to a nonlinear regression model, such as a neural network.
- the output for nonlinear regression model is the process metric(s).
- the nonlinear regression model is preferably trained by comparing a calculated process metric(s), based on measured sub-process metrics for an actual process run, with the actual process metric(s) as measured for the actual process run.
- the difference between calculated and measured process metric(s), or the error is used to compute the corrections to the adjustable parameters in the regression model. If the regression model is a neural network, these adjustable parameters are the connection weights between the layers of the neurons in the network.
- the nonlinear regression model is a neural network.
- the neural-network model architecture comprises a two-layer feedforward model with cascade correlation of the single hidden-layer nodes and an adaptive gradient algorithm for back-propagation of prediction errors to adjust network weights.
- Hidden units are added one at a time (or in vector candidate groups) and trained to maximize the correlation between the hidden unit's outputs and the residual error at the output of the current training process metrics (i.e., the training vector).
- Previously hidden units are connected or “cascaded” through weights to subsequent units to reduce the residual error not explained by previous hidden nodes.
- the present invention comprises: (1) providing a map between the sub-process metrics and process metrics using a nonlinear regression model; (2) providing one or more target process metrics; (3) providing an acceptable range of values for the sub-process metrics to define a sub-process metric constraint set; (4) providing a cost function for the sub-process metrics; (5) determining values for the sub-process metrics that are within the constraint set, and that produce at the lowest cost a process metric(s) that is as close as possible to the target process metric(s) in order to define target sub-process metrics for each sub-process; (6) determining a map between the operational variables of a sub-process and the metrics of the sub-process; (7) providing a cost function for the sub-process operational variables; and (8) determining values for the sub-process operational variables that produce at the lowest cost the sub-process metric, and that are as close as possible to the target sub-process metric values.
- operation variables includes sub-process controls that can be manipulated to vary the sub-process procedure, such as set point adjustments (referred to herein as “manipulated variables”), variables that indicate the wear, repair, or replacement status of a sub-process component(s) (referred to herein as “replacement variables”), and variables that indicate the calibration status of the sub-process controls (referred to herein as “calibration variables”).
- manipulated variables set point adjustments
- replacement variables variables that indicate the wear, repair, or replacement status of a sub-process component(s)
- calibration variables variables that indicate the calibration status of the sub-process controls
- acceptable values of sub-process operational variables include, but are not limited to, continuous values, discrete values and binary values.
- the operational variables for a plasma etch sub-process may be as follows: manipulated variables (“MV”) may include, e.g., RF power and process gas flow; replacement variables (“RV”) may include, e.g., time since last electrode replacement and/or a binary variable that indicates the need to replace/not replace the electrodes; and calibration variables (“CalV”) may include, e.g., time since last machine calibration and/or the need for calibration.
- MV manipulated variables
- RV replacement variables
- CalV calibration variables
- the invention comprises: (1) providing a map between the sub-process metrics and sub-process operational variables and the process metrics using a nonlinear regression model; (2) providing one or more target process metrics; (3) providing an acceptable range of values for the sub-process metrics and sub-process operational variables to define a sub-process operational constraint set; (4) providing a cost function for the sub-process metrics and operational variables; and (5) determining values for the sub-process metrics and operational variables that are within the constraint set, and that produce at the lowest cost a process metric(s) that is as close as possible to the a target process metric(s) in order to define target sub-process metrics and target operational variables for each sub-process.
- the invention comprises: (1) providing one or more target process metrics; (2) determining values for the sub-process metrics that are within a constraint set, and that produce at the lowest cost a process metric(s) that is as close as possible to the target process metric(s) to define a target sub-process metric for each sub-process; (3) detecting a substantial deviation in the metric(s) of at least one sub-process from its sub-process target metrics that defines a deviating sub-process; and (4) determining values for the sub-process metrics of the sub-process(es) downstream of the deviating sub-process, which metrics are within a constraint set and produce at the lowest cost a process metric(s) that is as close as possible to the target process metric(s) to define a compensating target sub-process metric(s) for each downstream sub-process.
- the present invention provides a method and system for minimizing the effects of a deviating sub-process on the outcome of the process by determining sub-process metrics for downstream sub
- a deviating sub-process comprises any sub-process that exhibits a sub-process metric that is outside of an acceptable range of values about a target value for the sub-process metric.
- the deviation may arise, for example, from a malfunction in the sub-process, an intentional change in the sub-process, and/or the inability of a sub-process, or process operator, to produce a sub-process metric within the acceptable range of values about a target value for the sub-process metric.
- the invention further comprises setting a new target process metric(s) based on the sub-process metrics of the deviating sub-process.
- the invention further comprises, (6) providing a map between the operational variables of a downstream sub-process and the metrics of that sub-process; (7) providing a cost function for the sub-process operational variables; and (8) determining values for the downstream sub-process operational variables that produce at the lowest cost the sub-process metric, and that are as close as possible to the compensating sub-process metric for that downstream sub-process.
- the present invention provides systems adapted to practice the methods of the invention set forth above.
- the system comprises a process monitor and a data processing device.
- the process monitor may comprise any device that provides information on process parameters and/or process metrics.
- the data processing device may comprise an analog and/or digital circuit configured to implement the functionality of one or more of the methods of the present invention using at least in part information provided by the process monitor.
- the information provided by the process monitor can be used directly to measure directly one or more metrics, operational variables, or both, associated with a process or sub-process.
- the information provided by the process monitor can also be used directly to train a non-linear regression model in the relationship between one or more of sub-process and process metrics, and sub-process metrics and sub-process operational variables (e.g., by using process parameter information as values for variables in an input vector and metrics as values for variables in a target output vector) or used to construct training data set for later use.
- the systems of the present invention are adapted to conduct continual, on-the-fly training of the non-linear regression model.
- system further comprises a process tool controller in electronic communication with the data processing device.
- the process tool controller may be any device capable of adjusting one or more process or sub-process operational variables in response to a control signal from the data processing device.
- the data processing device may implement the functionality of the methods of the present invention as software on a general purpose computer.
- a program may set aside portions of a computer's random access memory to provide control logic that affects one or more of the measuring of metrics, the measuring of operational variables, the provision of target metric values, the provision of constraint sets, the prediction of metrics, the determination of metrics, the implementation of an optimizer, determination of operational variables, and detecting deviations of or in a metric.
- the program may be written in any one of a number of high-level languages, such as FORTRAN, PASCAL, C, C++, Tcl, or BASIC.
- the program can be written in a script, macro, or functionality embedded in commercially available software, such as EXCEL or VISUAL BASIC.
- the software can be implemented in an assembly language directed to a microprocessor resident on a computer.
- the software can be implemented in Intel 80x86 assembly language if it is configured to run on an IBM PC or PC clone.
- the software may be embedded on an article of manufacture including, but not limited to, “computer-readable program means” such as a floppy disk, a hard disk, an optical disk, a magnetic tape, a PROM, an EPROM, or CD-ROM.
- the present invention provides an article of manufacture where the functionality of a method of the present invention is embedded on a computer-readable medium, such as, but not limited to, a floppy disk, a hard disk, an optical disk, a magnetic tape, a PROM, an EPROM, CD-ROM, or DVD-ROM.
- a computer-readable medium such as, but not limited to, a floppy disk, a hard disk, an optical disk, a magnetic tape, a PROM, an EPROM, CD-ROM, or DVD-ROM.
- FIG. 1 is a flow diagram illustrating various embodiments of prediction and optimization of a process according to the present invention.
- FIGS. 2A-2B are a flow diagram illustrating other various embodiment of prediction and optimization of a process according to the present invention.
- FIG. 3 is a flow diagram illustrating another embodiment of prediction and optimization of a process according to the present invention.
- FIGS. 4A-4B are a flow diagram illustrating various embodiment of compensating for a deviating sub-process of a process according to the present invention.
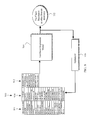
- FIG. 5 is a schematic illustration of various embodiments of a system adapted to practice the methods of the present invention.
- FIG. 6 is a schematic illustration of an illustrative structure produced by a metalization process, where the details of the transistor structures and metal runners (first level of interconnect) are not shown.
- FIGS. 7 is a schematic illustration of four sequential processing steps associated with manufacturing a metal layer and non-linear regression model training according to various embodiments of the present invention.
- FIG. 8 is a schematic illustration of four sequential processing steps associated with manufacturing a metal layer and a schematic illustration of process prediction and optimization according to various embodiments of the present invention.
- FIG. 9 is a schematic illustration of determining a map between sub-process metrics and sub-process operational variables according to various embodiments of the present invention.
- FIG. 10 is a schematic illustration of a hierarchical series of sub-process and process models and a schematic illustration of process prediction according to various embodiments of the present invention.
- FIG. 11 is a schematic illustration of a hierarchical series of sub-process and process models and a schematic illustration of process optimization according to various embodiments of the present invention.
- the method begins by providing a map between the metrics of a process and the metrics of two or more sub-processes 110 that define the process, one or more target process metrics 121 , an acceptable range of values for the sub-process metrics to define a sub-process metric constraint set 123 , and a cost function for the sub-process metrics 125 .
- the map is realized in the form of a nonlinear regression model trained in the relationship between the process metrics and sub-process metrics such that the nonlinear regression model can determine one or more predicted process metric values from one or more sub-process metric values.
- the process is optimized using the map 110 and an optimization model 127 to determine values for the sub-process metrics 130 that are within the constraint set, and that produce at the lowest cost a process metric(s) that is as close as possible to the target process metric(s) to define target sub-process metrics for each sub-process.
- the method of process optimization further comprises repeating the above optimization method at different hierarchical process levels (“YES” to query 140 ) where the process becomes the sub-process of the next repetition 152 or the sub-process becomes the process of the next repetition 154 .
- the method may be repeated for the sub-sub-processes of one or more sub-processes. That is, the sub-process becomes the “process” of boxes 110 - 130 in FIG. 1 and the sub-sub-process becomes the “sub-process” of boxes 110 - 130 .
- the method may be repeated for a higher-level process composed of two or more processes of the prior optimization. That is, the process becomes the “sub-process” of the new higher level process.
- the present invention may perform a hierarchical series of optimizations that can be scaled to any level of the overall production process.
- the method of process optimization comprises optimization of the process on two or more levels.
- the method begins by providing a map between the metrics of a process and the metrics of two or more sub-processes 210 defining the process, one or more target process metrics 221 , an acceptable range of values for the sub-process metrics to define a sub-process metric constraint set 223 , and a cost function for the sub-process metrics 225 .
- the map between one or more process and sub-process metrics is realized as a nonlinear regression model trained in the relationship between the process metrics and sub-process metrics such that the nonlinear regression model can determine one or more predicted process metric values from one or more sub-process metric values.
- the sub-process metrics are optimized using the map 210 and an optimization model 227 to determine values for the sub-process metrics that are within the sub-process metric constraint set 223 , and that produce at the lowest cost a process metric(s) that is as close as possible to the target process metric(s) in order to define target sub-process metrics for each sub-process 230 .
- the method continues with providing a map between one or more sub-process metrics and one or more operational variables of the associated sub-process 270 .
- the map between one or more sub-process metrics and one or more sub-process operational variables comprises a nonlinear regression model trained in the relationship between the sub-process metrics and sub-process operational variables such that the nonlinear regression model can determine one or more predicted sub-process metric values from one or more sub-process operational variable values.
- the sub-process metric and operational variable map 270 , an optimization model 273 and a provided operational variable cost function 275 are then used to determine target values for the sub-process operational variables 280 that are within an operational variable constraint set 281 , that produce at the lowest cost the sub-process metric, and that are as close as possible to the target sub-process metric values 283 .
- the optimization of sub-process operational variables is repeated (“YES” to query 285 ) for one or more sub-processes.
- the optimization method may further comprise measuring one or more sub-process metrics, one or more sub-process operational variables, or both 290 , and adjusting one or more of the sub-process operational variables substantially to its associated target value 295 .
- the map between process and sub-process metrics can be provided, for example, through the training of a nonlinear regression model against measured sub-process and process metrics.
- the sub-process metrics from each of the sub-processes serve as the input to a nonlinear regression model, such as a neural network.
- the output of the nonlinear regression model is the process metric(s).
- the nonlinear regression model is preferably trained by comparing a calculated process metric(s), based on measured sub-process metrics for an actual process run, with the actual process metric(s) as measured for the actual process run.
- the difference between calculated (i.e., predicted) and measured process metric(s), or the error is used to compute the corrections to the adjustable parameters in the regression model. If the regression model is a neural network, these adjustable parameters are the connection weights between the layers of the neurons in the network.
- the map between sub-process metrics and sub-process operational variables can be provided, for example, by determining the map through the training of a nonlinear regression model against measured sub-process metrics and sub-process operational variables.
- the sub-process operational variables from the sub-processes serves as the input to a nonlinear regression model, such as a neural network.
- the output of the nonlinear regression model is the sub-process metric(s).
- the nonlinear regression model is preferably trained by comparing a calculated sub-process metric(s), based on measured sub-process operational variables for an actual sub-process run, with the actual sub-process metric(s) as measured for the actual sub-process run.
- the difference between the calculated and measured sub-process metric(s), or the error is used to compute the corrections to the adjustable parameters in the regression model. If the regression model is a neural network, these adjustable parameters are the connection weights between the layers of the neurons in the network.
- a nonlinear regression model for use in the present invention comprises a neural network.
- the neural network model and training is as follows.
- connection weights W ij This equation states that the i th element of the input vector x is multiplied by the connection weights W ij . This product is then the argument for a hyperbolic tangent function, which results in another vector. This resulting vector is multiplied by another set of connection weights W jk .
- the subscript i spans the input space (i.e., sub-process metrics).
- the subscript j spans the space of hidden nodes, and the subscript k spans the output space (i.e., process metrics).
- the connection weights are elements of matrices, and may be found, for example, by gradient search of the error space with respect to the matrix elements.
- the first term represents the root-mean-square (“RMS”) error between the target t and the response r.
- the second term is a constraint that minimizes the magnitude of the connection weight W. If ⁇ (called the regularization coefficient) is large, it will force the weights to take on small magnitude values. With this weight constraint, the response error function will try to minimize the error and force this error to the best optimal between all the training examples.
- the coefficient y thus acts as an adjustable parameter for the desired degree of the nonlinearity in the model.
- the cost function can be representative, for example, of the actual monetary cost, or the time and labor, associated with achieving a sub-process metric.
- the cost function could also be representative of an intangible such as, for example, customer satisfaction, market perceptions, or business risk. Accordingly, it should be understood that it is not central to the present invention what, in actuality, the cost function represents; rather, the numerical values associated with the cost function may represent anything meaningful in terms of the application. Thus, it should be understood that the “cost” associated with the cost function is not limited to monetary costs.
- Cost functions are preferably defined for all input and output variables over the operating limits of the variables.
- the cost function applied to the vector z of n input and output variables at the nominal (current) values is represented as f(z) for z ⁇ n .
- a normalized cost value is assigned to each limit and an increasing piecewise linear cost function assumed for continuous variable operating values between limits.
- the cost functions are expressed as step functions.
- the optimization model (or method) comprises a genetic algorithm.
- the optimization is as for Optimizer I described below.
- the optimization is as for Optimizer II described below.
- the optimization strategies of Optimization I are utilized with the vector selection and pre-processing strategies of Optimization II.
- the optimization model is stated as follows:
- Vector z represents a vector of all input and output variable values, f(z), the objective function, and h(z), the associated constraint vector for elements of z.
- the variable vector z is composed of sub-process metric inputs, and process metric outputs.
- the vectors z L and z U represent the lower and upper operating ranges for the variables of z.
- the optimization method focuses on minimizing the cost of operation over the ranges of all input and output variables.
- the procedure seeks to minimize the maximum of the operating costs across all input and output variables, while maintaining all within acceptable operating ranges.
- the introduction of variables with discrete or binary values requires modification to handle the yes/no possibilities for each of these variables.
- m 1 the number of continuous input variables.
- m 2 the number of binary and discrete variables.
- m m 1 +m 2 , the total number of input variables.
- the binary/discrete variable cost function is altered slightly from a step function to a close approximation which maintains a small nonzero slope at no more than one point.
- the optimization model estimates the relationship between the set of continuous input values and the binary/discrete variables [z m 1 , z m 2 ] to the output continuous values [z p ].
- adjustment is made for model imprecision by introducing a constant error-correction factor applied to any estimate produced by the model specific to the current input vector.
- the error-corrected model becomes,
- e 0 m 0 +g(z 0 m 1 , z 0 m 2 ).
- g(z m 1 , z m 2 ) the prediction model output based on continuous input variables.
- g(z 0 m 1 , z 0 m 2 ) the prediction model output vector based on current input variables.
- h(z) the cost function vector of all input and output variables of a given process run record.
- cost value is determined by the piecewise continuous function.
- the optimization problem in this example, is to find a set of continuous input and binary/discrete input variables which minimize h(z).
- the binary/discrete variables represent discrete metrics (e.g., quality states such as poor/good), whereas the adjustment of the continuous variables produces a continuous metric space.
- the interaction between the costs for binary/discrete variables, h(z m 2 ), and the costs for the continuous output variables, h(z p ) are correlated and highly nonlinear.
- these problems are addressed by performing the optimization in two parts: a discrete component and continuous component.
- the set of all possible sequences of binary/discrete metric values is enumerated, including the null set. For computational efficiency, a subset of this set may be extracted.
- a heuristic optimization method designed to complement the embodiments described under Optimizer I is employed.
- the principal difference between the two techniques is in the weighting of the input-output variable listing.
- Optimizer II favors adjusting the variables that have the greatest individual impacts on the achievement of target output vector values, e.g., the target process metrics.
- Optimizer II achieves the specification ranges with a minimal number of input variables adjusted from the nominal. This is referred to as the “least labor alternative.” It is envisioned that when the optimization output of Optimizer II calls for adjustment of a subset of the variables adjusted using the embodiments of Optimizer I, these variables represent the principal subset involved with the achievement of the target process metric.
- the additional variable adjustments in the Optimization I algorithm may be minimizing overall cost through movement of the input variable into a lower cost region of operation.
- Optimization II proceeds as follows:
- the determination of s discrete vectors from an original vector set containing both continuous and binary/discrete variables may be arrived at by initial creation of a discrete rate change from nominal partitioning. For each continuous variable, several different rate changes from the nominal value are formed. For the binary variables only two partitions are possible. For example, a continuous variable rate-change partition of ⁇ 0.8 specifies reduction of the input variable by 80% from the current nominal value.
- the number of valid rate partitions for the m continuous variables is denoted as n m .
- a vector z is included in ⁇ according to the following criterion. (The case is presented for continuous input variables, with the understanding that the procedure follows for the binary/discrete variables with the only difference that two partitions are possible for each binary variable, not n m .) Each continuous variable is individually changed from its nominal setting across all rate partition values while the remaining m ⁇ 1 input variables are held at nominal value. The p output variables are computed from the inputs, forming z.
- z ik ⁇ is the value of the i th input variable at its k th rate partition from nominal.
- condition for accepting the specific variable at a specified rate change from nominal for inclusion in the optimization stage is as follows:
- the final set ⁇ of n-dimension vectors is composed of the crossing of all the elements of the sets ⁇ i of acceptable input variable rate-partitioned values from nominal.
- m 1 the number of continuous input variables
- m 2 the number of binary and discrete variables.
- the vector set ⁇ resembles a fully crossed main effects model which most aggressively approaches one or more of the targeted output values without violating the operating limits of the remaining output values.
- This weighting strategy for choice of input vector construction generally favors minimal variable adjustments to reach output targets.
- the approach favors the cost structure for which the majority of the output variables lie close to target, as compared to all variables being the same mean cost differential from target.
- Values of pV>>3 represent weighting the adherence of the output variables to target values as more important than adjustments of input variables to lower cost structures that result in no improvement in quality.
- the method of the invention comprises optimization of parameters from two different levels of a process (e.g., sub-process metrics and sub-process operational variables) against a parameter of a higher level (e.g., process metrics).
- a process e.g., sub-process metrics and sub-process operational variables
- the method provides a map between one or more metrics and operational variables of a sub-process and one or more process metrics 310 .
- the map serves as a nonlinear regression model trained in the relationship between A (the sub-process metrics and sub-process operational variables) and B (the process metrics) such that the nonlinear regression model can determine one or more predicted process metric values from one or more sub-process metric and sub-process operational variable values.
- the sub-process metric, operational variable and process metric map 310 , an optimization model 311 and a provided operational-variable cost function 315 are then used to determine target values for the sub-process metrics and target values for the sub-process operational variables 320 that are within a sub-process metric and sub-process operational variable constraint set 321 , that produce at the lowest cost the process metric, and that are as close as possible to the target process metric values 323 .
- the optimization method may further comprise measuring one or more sub-process metrics, one or more sub-process operational variables, or both 340 , and adjusting one or more of the sub-process operational variables substantially to its associated target value 350 .
- the map between sub-process metrics and sub-process operational variables and the process metrics can be provided, for example, by determining the map through the training of a nonlinear regression model against measured sub-process metrics, sub-process operational variables and process metrics.
- the sub-process metrics and operational variables serve as the input to a nonlinear regression model, such as a neural network.
- the output of the nonlinear regression model is the process metric(s).
- the nonlinear regression model is preferably trained by comparing a calculated process metric(s), based on measured sub-process metrics and operational variables for an actual process run, with the actual process metric(s) as measured for the actual process run.
- the difference between the calculated and measured process metric(s), or the error is used to compute the corrections to the adjustable parameters in the regression model. If the regression model is a neural network, these adjustable parameters are the connection weights between the layers of the neurons in the network.
- the provides a method of compensating for a deviating sub-process in a sequence of sub-process by determining sub-process metrics for one or more downstream sub-processes (i.e., sub-processes later in the process sequence than the deviating sub-process) that may compensate for the deviating sub-process.
- FIGS. 4A-4C illustrate various embodiments of this aspect of the invention are shown.
- the method comprises providing one or more target process metrics 411 , a sub-process metric constraint set 412 , a cost function for the sub-process metrics 413 , and a map between one or more sub-process metrics 414 and one or more process metrics, where the sub-process and process metric map 414 and an optimizer 415 are used to determine values for the sub-process metrics 420 that are within the constraint set 412 , and that produce at the lowest cost a process metric(s) that is as close as possible to the target process metric(s) 411 to define a target sub-process metric for each sub-process 420 .
- the method proceeds with setting the metrics of each sub-process as close as possible to its target metrics 430 . Once the sub-process metrics are set, if a substantial deviation in a sub-process metric is detected (“YES” to query 440 ), further action is undertaken.
- a deviating sub-process is any sub-process that exhibits a sub-process metric outside an acceptable range of values about a target value for the sub-process metric.
- the deviation may arise, for example, from a malfunction in the sub-process, an intentional change in the sub-process, and/or the inability of a sub-process, or process operator, to produce a sub-process metric within the acceptable range of values about a target value for the sub-process metric.
- values for the sub-process metrics of one or more of the sub-processes downstream of the deviating sub-process 460 are determined using the map 414 , an optimizer 461 and a provided cost function 463 , to define compensating target sub-process metric values for the one or more downstream sub-processes 460 based on one or more deviating sub-process metrics, where the compensating target sub-process metric values 460 are within a sub-process metric constraint set 465 and produce at the lowest cost a process metric(s) that is as close as possible to the target process metric(s) 411 .
- the method continues with providing a map between one or more downstream sub-process metrics and one or more operational variables of the associated downstream sub-process 470 .
- the sub-process metric and operational variable map 470 , an optimization model 473 , and a provided operational variable cost function 475 are then used to determine target values for the downstream sub-process operational variables 480 that are within an operational variable constraint set 481 , that produce at the lowest cost the sub-process metric, and that are as close as possible to the compensating target sub-process metric values.
- the optimization method may further comprise measuring one or more sub-process metrics, one or more sub-process operational variables, or both 490 , and adjusting one or more of the sub-process operational variables substantially to its associated target value 495 .
- the map between one or more sub-process metrics and one or more sub-process operational variables preferably comprises a nonlinear regression model trained in the relationship between the sub-process metrics and sub-process operational variables such that the nonlinear regression model can determine one or more predicted sub-process metric values from one or more sub-process operational variable values.
- the map between one or more sub-process metrics and one or more process metrics preferably comprises a nonlinear regression model trained in the relationship between the process metrics and sub-process metrics such that the nonlinear regression model can determine one or more predicted process metric values from one or more sub-process metric values.
- the present invention provides systems adapted to practice the methods of the invention set forth above.
- the system comprises a process monitor 501 in electronic communication with a data processing device 505 .
- the process monitor may comprise any device that provides information on variables, parameters, or process metrics of a process or sub-process.
- the process monitor may comprise a RF power monitor for a sub-process tool 506 .
- the data processing device may comprise an analog and/or digital circuit adapted to implement the functionality of one or more of the methods of the present invention using at least in part information provided by the process monitor.
- the information provided by the process monitor can be used, for example, to directly measure one or more metrics, operational variables, or both, associated with a process or sub-process.
- the information provided by the process monitor can also be used directly to train a non-linear regression model, implemented using data processing device 505 in a conventional manner, in the relationship between one or more of sub-process and process metrics, and sub-process metrics and sub-process operational variables (e.g., by using process parameter information as values for variables in an input vector and metrics as values for variables in a target output vector) or used to construct training data set for later use.
- the systems of the present invention are adapted to conduct continual, on-the-fly training of the non-linear regression model.
- the system further comprises a process tool controller 509 in electronic communication with the data processing device 505 .
- the process tool controller may be any device capable of adjusting one or more process or sub-process operational variables in response to a control signal from the data processing device.
- the process controller may comprise mechanical and/or electromechanical mechanisms to change the operational variables.
- the process controller may simply comprise a display that alerts a human operator to the desired operational variable values and who in turn effectuates the change.
- the process tool controller may comprise a circuit board that controls the RF power supply of a process tool 506 .
- the data processing device may implement the functionality of the methods of the present invention as software on a general purpose computer.
- a program may set aside portions of a computer's random access memory to provide control logic that affects one or more of the measuring of metrics, the measuring of operational variables, the provision of target metric values, the provision of constraint sets, the prediction of metrics, the determination of metrics, the implementation of an optimizer, determination of operational variables, and detecting deviations of or in a metric.
- the program may be written in any one of a number of high-level languages, such as FORTRAN, PASCAL, C, C++, Tcl, or BASIC.
- the program can be written in a script, macro, or functionality embedded in commercially available software, such as EXCEL or VISUAL BASIC.
- the software could be implemented in an assembly language directed to a microprocessor resident on a computer.
- the software can be implemented in Intel 80x86 assembly language if it is configured to run on an IBM PC or PC clone.
- the software may be embedded on an article of manufacture including, but not limited to, “computer-readable program means” such as a floppy disk, a hard disk, an optical disk, a magnetic tape, a PROM, an EPROM, or CD-ROM.
- the present invention provides an article of manufacture where the functionality of a method of the present invention is embedded on a computer-readable medium, such as, but not limited to, a floppy disk, a hard disk, an optical disk, a magnetic tape, a PROM, an EPROM, CD-ROM, or DVD-ROM.
- a computer-readable medium such as, but not limited to, a floppy disk, a hard disk, an optical disk, a magnetic tape, a PROM, an EPROM, CD-ROM, or DVD-ROM.
- the functionality of the method may be embedded on the computer-readable medium in any number of computer-readable instructions, or languages such as, for example, FORTRAN, PASCAL, C, C++, Tcl, BASIC and assembly language.
- the computer-readable instructions can, for example, be written in a script, macro, or functionally embedded in commercially available software (such as, e.g., EXCEL or VISUAL BASIC).
- the following example pertains to a metalization layer process utilized during the manufacture of integrated circuits.
- Examples of input variables for a non-linear regression model of a metalization process or sub-process are listed in the following Table 1, and include sub-process operational variables “process variables” and “maintenance variables” columns, and sub-process metrics, “metrology variables” column.
- Examples of output variables for a non-linear regression model of a metalization process or sub-process are also listed in Table 1, which include sub-process metrics, “metrology variables” column, and process metrics “yield metric” column.
- variable maintenance yield process variables variables metrology variables metric cvd tool id cvd tool mfc1 cvd control wafer via chain resistance cvd tool pressure cvd tool mfc2 cmp control wafer cvd tool gas flow cvd tool mfc3 cmp product wafer cvd tool cvd tool electrode litho/pr control termperature wafer cvd tool . . . cvd tool up time litho/pr product wafer cmp tool id cmp tool pad etch control wafer cmp tool speed cmp tool slurry etch product wafer cmp tool slurry cmp pad moter cmp tool cmp calibration temperature cmp tool .
- the transistors 601 Prior to the first layer of metalization, the transistors 601 are manufactured and a first level of interconnection 603 is prepared. This is shown schematically in FIG. 6 . The details of the transistor structures and the details of the metal runners (first level of interconnect) are not shown.
- the first step in the manufacture of integrated circuits is typically to prepare the transistors 601 on the silicon wafer 605 .
- the nearest neighbors that need to be connected are then wired up with the first level of interconnection 603 .
- the connections stem from the circuit functionality.
- the sequential metalization layers e.g., a first layer 607 , a second layer 609 , a third layer 611 , etc., are fabricated where the metalization layers are separated by levels of oxide 613 and interconnected by vias 615 .
- FIG. 7 schematically illustrates four sequential processing steps 710 , i.e., sub-processes, that are associated with manufacturing a metal layer (i.e., the metalization layer process). These four processing steps are: (1) oxide deposition 712 ; (2) chemical mechanical planerization 714 ; (3) lithography 716 ; and (4) via etch 718 . Also illustrated are typical associated sub-process metrics 720 .
- Oxide deposition is typically accomplished using a process known as PECVD (plasma-enhanced chemical vapor deposition), or simply CVD herein.
- PECVD plasma-enhanced chemical vapor deposition
- a blank monitor wafer also known as a blanket wafer
- This monitor wafer is used to determine the amount of oxide deposited on the wafer.
- there are typically one or more monitor wafers providing metrology data (i.e., metrics for the sub-process) on the film thickness, as grown, on the product wafer.
- This film thickness 722 is a metric of the oxide-deposition sub-process.
- CMP chemical mechanical planarization
- This processing step is also referred to as chemical mechanical polishing.
- CMP is a critical sub-process because after the growth of the oxide, the top surface of the oxide layer takes on the underlying topology. Generally, if this surface is not smoothed the succeeding layers will not match directly for subsequent processing steps.
- a film thickness may be measured from a monitor wafer or, more commonly, from product wafers. Frequently, a measure of the uniformity of the film thickness is also obtained. Accordingly, film thickness and film uniformity 724 are in this example the metrics of the CMP sub-process.
- the lithography processing step 716 in which a photoresist is spun-on the wafer, patterned, and developed.
- the photoresist pattern defines the position of the vias, i.e., tiny holes passing directly through the oxide layer. Vias facilitate connection among transistors and metal traces on different layers. This is shown schematically in FIG. 6 .
- metrics of the lithography sub-process may include the photoresist set-up parameters 726 .
- the last sub-process shown in FIG. 7 is the via etch sub-process 718 .
- This is a plasma etch designed to etch tiny holes through the oxide layer.
- the metal interconnects from layer to layer are then made.
- film thickness measurements indicating the degree of etch are typically obtained.
- measurements of the diameter of the via hole, and a measurement of any oxide or other material in the bottom of the hole may also be made.
- two of these measurements, film thickness and via hole profile 728 are used as the via etch sub-process metrics.
- the metal deposition sub-process comprises sputter deposition of a highly conductive metal layer.
- the end result can be, for example, the connectivity shown schematically in FIG. 6 .
- the metal deposition sub-process is not shown to illustrate that not every sub-process of a given process need be considered to practice and obtain the objectives of the present invention. Instead, only a certain subset of the sub-processes may be used to control and predict the overall process.
- Each metal layer is prepared by repeating these same sub-process steps.
- Some integrated microelectronic chips contain six or more metal layers. The larger the metal stack, the more difficult it is to manufacture the devices.
- the wafers When the wafers have undergone a metalization layer process, they are typically sent to a number of stations for testing and evaluation. Commonly, during each of the metalization layer processes there are also manufactured on the wafer tiny structures known as via-chain testers or metal-to-metal resistance testers. The via chain resistance 752 measured using these structures represents the process metric of this example. This process metric, also called a yield metric, is indicative of the performance of the cluster of processing steps, i.e., sub-processes. Further, with separate via-chain testers for each metalization layer process, the present invention can determine manufacturing faults at individual clusters of sub-processes.
- the sub-process metrics from each of the sub-processes become the input to a nonlinear regression model 760 .
- the output for this model is the calculated process metric 762 ; in the present example, this is the via-chain resistance.
- the nonlinear regression model is trained as follows.
- the model calculates a via-chain resistance 762 using the input sub-process metrics 720 .
- the calculated via chain resistance 762 is compared 770 with the actual resistance 752 as measured during the wafer-testing phase.
- the difference, or the error, 780 is used to compute corrections to the adjustable parameters in the regression model 760 .
- the procedure of calculation, comparison, and correction is repeated with other training sets of input and output data until the error of the model reaches an acceptable level.
- An illustrative example of such a training scheme is shown schematically in FIG. 7 .
- FIG. 8 schematically illustrates the optimization of the sub-process metrics 720 with an “optimizer” 801 .
- the optimizer 801 operates according to the principles hereinabove described, determining target sub-process metrics 811 that are within the constraint set 813 and are predicted to achieve a process metric(s) as close to the target process metric(s) 815 as possible while maintaining the lowest cost feasible.
- the optimization procedure begins by setting an acceptable range of values for the sub-process metrics to define a sub-process metric constraint set 813 and by setting one or more target process metrics 815 .
- the optimization procedure then optimizes the sub-process metrics against a cost function for the sub-process metrics.
- the constraint set 813 could comprise minimum and maximum values for the oxide deposition film thickness metric, the CMP film thickness and film uniformity metrics, the lithography photoresist set up parameters, and the via etch hole profile and film thickness metrics.
- the target process metric, via chain resistance 815 is set at a desired value, e.g., zero.
- the optimizer 801 is run to determine the values of the various sub-process metrics (i.e., target sub-process metrics 811 ) that are predicted to produce a via chain resistance as close as possible to the target value 815 (i.e., zero) at the lowest cost.
- an additional level of prediction and control is employed. This additional level of prediction and control is illustrated in FIG. 8 by the loop arrows labeled “feedback control loop” 830 .
- a map is determined between the operational variables of a sub-process and the metrics of that sub-process, and a cost function is provided for the sub-process operational variables.
- values for the sub-process operational variables are determined that produce at the lowest cost the sub-process metric, and that are as close as possible to the target sub-process metric values, to define target operational variables.
- an acceptable range of values for the sub-process operational variables is identified to define a sub-process operational variable constraint set, and the operational variables are then optimized such that the target operational variables fall within the constraint set.
- the optimization method comprises a genetic algorithm.
- the optimization is as for Optimizer I described above.
- the optimization is as for Optimizer II described above.
- the optimization strategies of Optimization I are utilized with the vector selection and pre-processing strategies of Optimization II.
- FIG. 9 schematically illustrates an embodiment of the invention, in the context of the present metalization layer process example, that comprises determining a map between the sub-process metrics and sub-process operational variables and the process metrics using a nonlinear regression model.
- the input variables 910 to the nonlinear regression model 760 comprise both process metrics 912 and sub-process operational variables 914 , 916 .
- FIG. 9 further illustrates that in this embodiment, the optimizer 920 acts on both the sub-process metrics and operational parameters to determine values for the sub-process metrics and operational variables that are within the constraint set, and that produce at the lowest cost a process metric(s) 752 that is as close as possible to the a target process metric(s) to define target sub-process metrics and target operational variables for each sub-process.
- one embodiment of the present invention comprises a hierarchical series of sub-process and process models. As seen in FIG. 6, there are several levels of metalization. As illustrated in FIG. 10, a new model is formed where each metalization layer process performed, such as illustrated in FIGS. 7 and 8, becomes a sub-process 1010 in a new higher level process, i.e., complete metalization in this example. As illustrated in FIGS. 10 and 11, the sub-process metrics 1020 are the via chain resistances of a given metalization layer process, and the process metrics of the complete metalization process are the IV (current-voltage) parameters 1030 of the wafers. FIG. 10 provides an illustrative schematic of training the nonlinear regression model 1060 for the new higher level process, and FIG. 11 illustrates its use in optimization.
- the nonlinear regression model 1060 is trained in the relationship between the sub-process metrics 1020 and process metric(s) 1030 in a manner analogous to that illustrated in FIG. 7 .
- the sub-process metrics 1020 from each of the sub-processes 1010 become the input to the nonlinear regression model 1060 .
- the output for this model is the calculated process metrics 1062 ; in the present example, these are the IV parameters.
- the nonlinear regression model is trained as follows.
- the model calculates IV parameters 1062 using the input sub-process metrics 1020 .
- the calculated IV parameters 1062 are compared as indicated at 1070 with the actual IV parameters as measured during the wafer-testing phase 1030 .
- the difference, or the error, 1080 is used to compute corrections to the adjustable parameters in the regression model 1060 .
- the procedure of calculation, comparison, and correction is repeated with other training sets of input and output data until the error of the model reaches an acceptable level.
- the optimizer 1101 determines target sub-process metrics 1111 that are within the constraint set 1113 and are predicted to achieve a process metric(s) as close to the target process metric(s) 1115 as possible while maintaining the lowest cost feasible.
- the optimization procedure begins by setting an acceptable range of values for the sub-process metrics to define a sub-process metric constraint set 1113 and by setting one or more target process metrics 1115 .
- the optimization procedure then optimizes the sub-process metrics against a cost function for the sub-process metrics.
- the constraint set 1113 may comprise minimum and maximum values for the via chain resistances of the various metal layers.
- the target process metric, IV parameters, 1115 are set to desired values and the optimizer 1101 is run to determine the values of the various sub-process metrics (i.e., target sub-process metrics 1111 ) that are predicted to produce IV parameters as close as possible (e.g., in a total error sense) to the target value 1115 at the lowest cost.
- an additional level of prediction and control is employed. This additional level of prediction and control is illustrated in FIG. 11 by the feedback control loop arrows 1130 .
- a map is determined between the operational variables of a sub-process and the metrics of that sub-process, and a cost function is provided for the sub-process operational variables, which in this example may also be the operational variables of a sub-sub-process.
- values for the sub-process operational variables are determined that produce at the lowest cost the sub-process metric, and that are as close as possible to the target sub-process metric values, to define target operational variables.
- an acceptable range of values for the sub-process operational variables is identified to define a sub-process operational variable constraint set, and the operational variables are then optimized such that the target operational variables fall within the constraint set.
Abstract
The present invention provides a method and system for complex process optimization utilizing metrics, operational variables, or both, of one or more process steps and optimization of one or more of these process step parameters with respect to a cost function for the parameter. In one embodiment, the invention provides a scalable, hierarchical optimization method utilizing optimizations at one process level as inputs to an optimization of a higher or lower process level.
Description
The present application claims the benefit of and priority to copending U.S. provisional application Ser. No. 60/322,406, filed Sep. 14, 2001, the entire disclosure of which is herein incorporated by reference.
The invention relates to the field of data processing and process control. In particular, the invention relates to nonlinear regression prediction and/or control of complex multi-step processes.
Process prediction and control is crucial to optimizing the outcome of complex multi-step production processes. For example, the production process for integrated circuits comprises hundreds of process steps (i.e., sub-processes). In turn, each process step may have several controllable parameters, or inputs, that affect the outcome of the process step, subsequent process steps, and/or the process as a whole. In addition, the impact of the controllable parameters on outcome may vary from process run to process run, day to day, or hour to hour. The typical integrated circuit fabrication process thus has a thousand or more controllable inputs, any number of which may be cross-correlated and have a time-varying, nonlinear relationship with the process outcome. As a result, process prediction and control is crucial to optimizing process parameters and to obtaining, or maintaining, acceptable outcomes.
The present invention provides a method and system for complex process prediction and optimization utilizing sub-process metrics and optimization of the sub-process metrics with respect to a cost function for the process.
In one aspect, the invention comprises: (1) providing a map between the sub-process metrics and process metrics using a nonlinear regression model; (2) providing one or more target process metrics; (3) providing an acceptable range of values for the sub-process metrics to define a sub-process metric constraint set; (4) providing a cost function for the sub-process metrics; and (5) determining values for the sub-process metrics that are within the constraint set, and that produce at the lowest cost a process metric(s) that is as close as possible to the target process metric(s) in order to define target sub-process metrics for each sub-process.
In another aspect of the invention, steps (1) to (5) in the preceding paragraph are applied at different hierarchical process levels. For example these steps may be repeated for sub-sub-processes of one or more sub-processes. (That is, the sub-process becomes the “process” of steps (1) to (5) and the sub-sub-process becomes the “sub-process.”) Similarly, in another aspect of the invention, steps (1) to (5) in the preceding paragraph are repeated for a higher level process composed of two or more processes from step (1). (That is, the process becomes the “sub-process” of the new higher level process.) In effect, the present invention may perform a hierarchical series of steps (1) to (5) that can be scaled to any level of the overall production process.
As used herein, the term “metric” refers to any parameter used to measure the outcome or quality of a process or sub-process. Metrics include parameters determined both in situ during the running of a sub-process or process, and ex situ, at the end of a sub-process or process.
The map between sub-process metrics and process metrics is preferably determined by training a nonlinear regression model against measured sub-process and process metrics. The sub-process metrics from each of the sub-processes serve as the input to a nonlinear regression model, such as a neural network. The output for nonlinear regression model is the process metric(s). The nonlinear regression model is preferably trained by comparing a calculated process metric(s), based on measured sub-process metrics for an actual process run, with the actual process metric(s) as measured for the actual process run. The difference between calculated and measured process metric(s), or the error, is used to compute the corrections to the adjustable parameters in the regression model. If the regression model is a neural network, these adjustable parameters are the connection weights between the layers of the neurons in the network.
In one embodiment, the nonlinear regression model is a neural network. In one version, the neural-network model architecture comprises a two-layer feedforward model with cascade correlation of the single hidden-layer nodes and an adaptive gradient algorithm for back-propagation of prediction errors to adjust network weights. Hidden units are added one at a time (or in vector candidate groups) and trained to maximize the correlation between the hidden unit's outputs and the residual error at the output of the current training process metrics (i.e., the training vector). Previously hidden units are connected or “cascaded” through weights to subsequent units to reduce the residual error not explained by previous hidden nodes.
In another aspect, the present invention comprises: (1) providing a map between the sub-process metrics and process metrics using a nonlinear regression model; (2) providing one or more target process metrics; (3) providing an acceptable range of values for the sub-process metrics to define a sub-process metric constraint set; (4) providing a cost function for the sub-process metrics; (5) determining values for the sub-process metrics that are within the constraint set, and that produce at the lowest cost a process metric(s) that is as close as possible to the target process metric(s) in order to define target sub-process metrics for each sub-process; (6) determining a map between the operational variables of a sub-process and the metrics of the sub-process; (7) providing a cost function for the sub-process operational variables; and (8) determining values for the sub-process operational variables that produce at the lowest cost the sub-process metric, and that are as close as possible to the target sub-process metric values.
As used herein, the term “operational variables” includes sub-process controls that can be manipulated to vary the sub-process procedure, such as set point adjustments (referred to herein as “manipulated variables”), variables that indicate the wear, repair, or replacement status of a sub-process component(s) (referred to herein as “replacement variables”), and variables that indicate the calibration status of the sub-process controls (referred to herein as “calibration variables”). Furthermore, it should be understood that acceptable values of sub-process operational variables include, but are not limited to, continuous values, discrete values and binary values.
For example, where the process comprises plasma etching of silicon wafers, the operational variables for a plasma etch sub-process, such as performed by a LAM 4520 plasma etch tool, may be as follows: manipulated variables (“MV”) may include, e.g., RF power and process gas flow; replacement variables (“RV”) may include, e.g., time since last electrode replacement and/or a binary variable that indicates the need to replace/not replace the electrodes; and calibration variables (“CalV”) may include, e.g., time since last machine calibration and/or the need for calibration.
In another aspect, the invention comprises: (1) providing a map between the sub-process metrics and sub-process operational variables and the process metrics using a nonlinear regression model; (2) providing one or more target process metrics; (3) providing an acceptable range of values for the sub-process metrics and sub-process operational variables to define a sub-process operational constraint set; (4) providing a cost function for the sub-process metrics and operational variables; and (5) determining values for the sub-process metrics and operational variables that are within the constraint set, and that produce at the lowest cost a process metric(s) that is as close as possible to the a target process metric(s) in order to define target sub-process metrics and target operational variables for each sub-process.
In another aspect, the invention comprises: (1) providing one or more target process metrics; (2) determining values for the sub-process metrics that are within a constraint set, and that produce at the lowest cost a process metric(s) that is as close as possible to the target process metric(s) to define a target sub-process metric for each sub-process; (3) detecting a substantial deviation in the metric(s) of at least one sub-process from its sub-process target metrics that defines a deviating sub-process; and (4) determining values for the sub-process metrics of the sub-process(es) downstream of the deviating sub-process, which metrics are within a constraint set and produce at the lowest cost a process metric(s) that is as close as possible to the target process metric(s) to define a compensating target sub-process metric(s) for each downstream sub-process. In this aspect, the present invention provides a method and system for minimizing the effects of a deviating sub-process on the outcome of the process by determining sub-process metrics for downstream sub-processes that may compensate for the deviating sub-process.
A deviating sub-process comprises any sub-process that exhibits a sub-process metric that is outside of an acceptable range of values about a target value for the sub-process metric. The deviation may arise, for example, from a malfunction in the sub-process, an intentional change in the sub-process, and/or the inability of a sub-process, or process operator, to produce a sub-process metric within the acceptable range of values about a target value for the sub-process metric.
In one embodiment of the invention described in the preceding paragraphs, the invention further comprises setting a new target process metric(s) based on the sub-process metrics of the deviating sub-process. In another embodiment of the invention described in the preceding paragraph, the invention further comprises, (6) providing a map between the operational variables of a downstream sub-process and the metrics of that sub-process; (7) providing a cost function for the sub-process operational variables; and (8) determining values for the downstream sub-process operational variables that produce at the lowest cost the sub-process metric, and that are as close as possible to the compensating sub-process metric for that downstream sub-process.
In other aspects, the present invention provides systems adapted to practice the methods of the invention set forth above. In one embodiment, the system comprises a process monitor and a data processing device. The process monitor may comprise any device that provides information on process parameters and/or process metrics. The data processing device may comprise an analog and/or digital circuit configured to implement the functionality of one or more of the methods of the present invention using at least in part information provided by the process monitor. The information provided by the process monitor can be used directly to measure directly one or more metrics, operational variables, or both, associated with a process or sub-process. The information provided by the process monitor can also be used directly to train a non-linear regression model in the relationship between one or more of sub-process and process metrics, and sub-process metrics and sub-process operational variables (e.g., by using process parameter information as values for variables in an input vector and metrics as values for variables in a target output vector) or used to construct training data set for later use. In addition, in one embodiment, the systems of the present invention are adapted to conduct continual, on-the-fly training of the non-linear regression model.
In another embodiment, the system further comprises a process tool controller in electronic communication with the data processing device. The process tool controller may be any device capable of adjusting one or more process or sub-process operational variables in response to a control signal from the data processing device.
In some embodiments, the data processing device may implement the functionality of the methods of the present invention as software on a general purpose computer. In addition, such a program may set aside portions of a computer's random access memory to provide control logic that affects one or more of the measuring of metrics, the measuring of operational variables, the provision of target metric values, the provision of constraint sets, the prediction of metrics, the determination of metrics, the implementation of an optimizer, determination of operational variables, and detecting deviations of or in a metric. In such an embodiment, the program may be written in any one of a number of high-level languages, such as FORTRAN, PASCAL, C, C++, Tcl, or BASIC. Further, the program can be written in a script, macro, or functionality embedded in commercially available software, such as EXCEL or VISUAL BASIC. Additionally, the software can be implemented in an assembly language directed to a microprocessor resident on a computer. For example, the software can be implemented in Intel 80x86 assembly language if it is configured to run on an IBM PC or PC clone. The software may be embedded on an article of manufacture including, but not limited to, “computer-readable program means” such as a floppy disk, a hard disk, an optical disk, a magnetic tape, a PROM, an EPROM, or CD-ROM.
In a further aspect, the present invention provides an article of manufacture where the functionality of a method of the present invention is embedded on a computer-readable medium, such as, but not limited to, a floppy disk, a hard disk, an optical disk, a magnetic tape, a PROM, an EPROM, CD-ROM, or DVD-ROM.
A fuller understanding of the advantages, nature and objects of the invention may be had by reference to the following illustrative description, when taken in conjunction with the accompanying drawings. The drawings are not necessarily drawn to scale, and like reference numerals refer to the same items throughout the different views.
FIG. 1 is a flow diagram illustrating various embodiments of prediction and optimization of a process according to the present invention.
FIGS. 2A-2B are a flow diagram illustrating other various embodiment of prediction and optimization of a process according to the present invention.
FIG. 3 is a flow diagram illustrating another embodiment of prediction and optimization of a process according to the present invention.
FIGS. 4A-4B are a flow diagram illustrating various embodiment of compensating for a deviating sub-process of a process according to the present invention.
FIG. 5 is a schematic illustration of various embodiments of a system adapted to practice the methods of the present invention.
FIG. 6 is a schematic illustration of an illustrative structure produced by a metalization process, where the details of the transistor structures and metal runners (first level of interconnect) are not shown.
FIGS. 7 is a schematic illustration of four sequential processing steps associated with manufacturing a metal layer and non-linear regression model training according to various embodiments of the present invention.
FIG. 8 is a schematic illustration of four sequential processing steps associated with manufacturing a metal layer and a schematic illustration of process prediction and optimization according to various embodiments of the present invention.
FIG. 9 is a schematic illustration of determining a map between sub-process metrics and sub-process operational variables according to various embodiments of the present invention.
FIG. 10 is a schematic illustration of a hierarchical series of sub-process and process models and a schematic illustration of process prediction according to various embodiments of the present invention.
FIG. 11 is a schematic illustration of a hierarchical series of sub-process and process models and a schematic illustration of process optimization according to various embodiments of the present invention.
Referring to FIG. 1, a flow chart of various embodiments of a method of process optimization according to the present invention is shown. The method begins by providing a map between the metrics of a process and the metrics of two or more sub-processes 110 that define the process, one or more target process metrics 121, an acceptable range of values for the sub-process metrics to define a sub-process metric constraint set 123, and a cost function for the sub-process metrics 125. Preferably, the map is realized in the form of a nonlinear regression model trained in the relationship between the process metrics and sub-process metrics such that the nonlinear regression model can determine one or more predicted process metric values from one or more sub-process metric values. The process is optimized using the map 110 and an optimization model 127 to determine values for the sub-process metrics 130 that are within the constraint set, and that produce at the lowest cost a process metric(s) that is as close as possible to the target process metric(s) to define target sub-process metrics for each sub-process.
In one embodiment, the method of process optimization further comprises repeating the above optimization method at different hierarchical process levels (“YES” to query 140) where the process becomes the sub-process of the next repetition 152 or the sub-process becomes the process of the next repetition 154. In one version, the method may be repeated for the sub-sub-processes of one or more sub-processes. That is, the sub-process becomes the “process” of boxes 110-130 in FIG. 1 and the sub-sub-process becomes the “sub-process” of boxes 110-130. In another version of this embodiment, the method may be repeated for a higher-level process composed of two or more processes of the prior optimization. That is, the process becomes the “sub-process” of the new higher level process. In effect, the present invention may perform a hierarchical series of optimizations that can be scaled to any level of the overall production process.
Referring to FIGS. 2A and 2B, in other embodiments, the method of process optimization comprises optimization of the process on two or more levels. The method begins by providing a map between the metrics of a process and the metrics of two or more sub-processes 210 defining the process, one or more target process metrics 221, an acceptable range of values for the sub-process metrics to define a sub-process metric constraint set 223, and a cost function for the sub-process metrics 225. Preferably, the map between one or more process and sub-process metrics is realized as a nonlinear regression model trained in the relationship between the process metrics and sub-process metrics such that the nonlinear regression model can determine one or more predicted process metric values from one or more sub-process metric values. The sub-process metrics are optimized using the map 210 and an optimization model 227 to determine values for the sub-process metrics that are within the sub-process metric constraint set 223, and that produce at the lowest cost a process metric(s) that is as close as possible to the target process metric(s) in order to define target sub-process metrics for each sub-process 230.
Referring to FIG. 2B, the method continues with providing a map between one or more sub-process metrics and one or more operational variables of the associated sub-process 270. Preferably, the map between one or more sub-process metrics and one or more sub-process operational variables comprises a nonlinear regression model trained in the relationship between the sub-process metrics and sub-process operational variables such that the nonlinear regression model can determine one or more predicted sub-process metric values from one or more sub-process operational variable values. The sub-process metric and operational variable map 270, an optimization model 273 and a provided operational variable cost function 275 are then used to determine target values for the sub-process operational variables 280 that are within an operational variable constraint set 281, that produce at the lowest cost the sub-process metric, and that are as close as possible to the target sub-process metric values 283.
In one embodiment, the optimization of sub-process operational variables is repeated (“YES” to query 285) for one or more sub-processes. In addition, in various embodiments, the optimization method may further comprise measuring one or more sub-process metrics, one or more sub-process operational variables, or both 290, and adjusting one or more of the sub-process operational variables substantially to its associated target value 295.
In all of the embodiments of the present invention, the map between process and sub-process metrics can be provided, for example, through the training of a nonlinear regression model against measured sub-process and process metrics. The sub-process metrics from each of the sub-processes serve as the input to a nonlinear regression model, such as a neural network. The output of the nonlinear regression model is the process metric(s). The nonlinear regression model is preferably trained by comparing a calculated process metric(s), based on measured sub-process metrics for an actual process run, with the actual process metric(s) as measured for the actual process run. The difference between calculated (i.e., predicted) and measured process metric(s), or the error, is used to compute the corrections to the adjustable parameters in the regression model. If the regression model is a neural network, these adjustable parameters are the connection weights between the layers of the neurons in the network.
In all of the embodiments of the present invention, the map between sub-process metrics and sub-process operational variables can be provided, for example, by determining the map through the training of a nonlinear regression model against measured sub-process metrics and sub-process operational variables. The sub-process operational variables from the sub-processes serves as the input to a nonlinear regression model, such as a neural network. The output of the nonlinear regression model is the sub-process metric(s). The nonlinear regression model is preferably trained by comparing a calculated sub-process metric(s), based on measured sub-process operational variables for an actual sub-process run, with the actual sub-process metric(s) as measured for the actual sub-process run. The difference between the calculated and measured sub-process metric(s), or the error, is used to compute the corrections to the adjustable parameters in the regression model. If the regression model is a neural network, these adjustable parameters are the connection weights between the layers of the neurons in the network.
In various embodiments, a nonlinear regression model for use in the present invention comprises a neural network. Specifically, in one version, the neural network model and training is as follows. The output of the neural network, r, is given by 
This equation states that the ith element of the input vector x is multiplied by the connection weights Wij. This product is then the argument for a hyperbolic tangent function, which results in another vector. This resulting vector is multiplied by another set of connection weights Wjk. The subscript i spans the input space (i.e., sub-process metrics). The subscript j spans the space of hidden nodes, and the subscript k spans the output space (i.e., process metrics). The connection weights are elements of matrices, and may be found, for example, by gradient search of the error space with respect to the matrix elements. The response error function for the minimization of the output response error is given by 
The first term represents the root-mean-square (“RMS”) error between the target t and the response r. The second term is a constraint that minimizes the magnitude of the connection weight W. If γ (called the regularization coefficient) is large, it will force the weights to take on small magnitude values. With this weight constraint, the response error function will try to minimize the error and force this error to the best optimal between all the training examples. The coefficient y thus acts as an adjustable parameter for the desired degree of the nonlinearity in the model.
In all of the embodiments of the present invention, the cost function can be representative, for example, of the actual monetary cost, or the time and labor, associated with achieving a sub-process metric. The cost function could also be representative of an intangible such as, for example, customer satisfaction, market perceptions, or business risk. Accordingly, it should be understood that it is not central to the present invention what, in actuality, the cost function represents; rather, the numerical values associated with the cost function may represent anything meaningful in terms of the application. Thus, it should be understood that the “cost” associated with the cost function is not limited to monetary costs.
The condition of lowest cost, as defined by the cost function, is the optimal condition, while the requirement of a metric or operational variable to follow defined cost functions and to be within accepted value ranges represents the constraint set. Cost functions are preferably defined for all input and output variables over the operating limits of the variables. The cost function applied to the vector z of n input and output variables at the nominal (current) values is represented as f(z) for zεn.
For input and output variables with continuous values, a normalized cost value is assigned to each limit and an increasing piecewise linear cost function assumed for continuous variable operating values between limits. For variables with discrete or binary values, the cost functions are expressed as step functions.
In one embodiment, the optimization model (or method) comprises a genetic algorithm. In another embodiment, the optimization is as for Optimizer I described below. In another embodiment, the optimization is as for Optimizer II described below. In another embodiment, the optimization strategies of Optimization I are utilized with the vector selection and pre-processing strategies of Optimization II.
Optimizer I
In one embodiment, the optimization model is stated as follows:
Min (f(z)
zεn
s.t. h(z)=a
zL<z<zU
where f: n→ and h: n→n.
Vector z represents a vector of all input and output variable values, f(z), the objective function, and h(z), the associated constraint vector for elements of z. The variable vector z is composed of sub-process metric inputs, and process metric outputs. The vectors zL and zU represent the lower and upper operating ranges for the variables of z.
In one implementation, the optimization method focuses on minimizing the cost of operation over the ranges of all input and output variables. The procedure seeks to minimize the maximum of the operating costs across all input and output variables, while maintaining all within acceptable operating ranges. The introduction of variables with discrete or binary values requires modification to handle the yes/no possibilities for each of these variables.
The following basic notation is useful in describing this optimization model.
m1=the number of continuous input variables.
m2=the number of binary and discrete variables.
p=the number of output variables.
m=m1+m2, the total number of input variables.
zm 1 εm 1 =vector of m1 continuous input variables.
zm 2 εm 2 =the vector of m2 binary and discrete input variables.
zpεp=the vector of p continuous output variables.
Also let
the vector of all input variables and output variables for a given process run.
As mentioned above, two different forms of the cost function exist: one for continuous variables and another for the discrete and binary variables. In one embodiment, the binary/discrete variable cost function is altered slightly from a step function to a close approximation which maintains a small nonzero slope at no more than one point.
The optimization model estimates the relationship between the set of continuous input values and the binary/discrete variables [zm 1 , zm 2 ] to the output continuous values [zp]. In one embodiment, adjustment is made for model imprecision by introducing a constant error-correction factor applied to any estimate produced by the model specific to the current input vector. The error-corrected model becomes,
where
e0=m0+g(z0 m 1 , z0 m 2 ).
g(zm 1 , zm 2 )=the prediction model output based on continuous input variables.
g: m 1 +m 2 →p binary and discrete input variables.
g(z0 m 1 , z0 m 2 )=the prediction model output vector based on current input variables.
m0εp=the observed output vector for the current (nominal) state of inputs.
h(z)=the cost function vector of all input and output variables of a given process run record.
h(z(i))=the ith element of the cost function vector, for i=1, . . . , m+p.
For the continuous input and output variables, cost value is determined by the piecewise continuous function. For the p continuous output variables
For h(z), the cost function vector for all the input and output variables of a given process run record, the scalar max h(z)=max{h(z(i)): i=1, 2, . . . , m+p}, is defined as the maximum cost value of the set of continuous input variables, binary/discrete input variables, and output variables.
The optimization problem, in this example, is to find a set of continuous input and binary/discrete input variables which minimize h(z). The binary/discrete variables represent discrete metrics (e.g., quality states such as poor/good), whereas the adjustment of the continuous variables produces a continuous metric space. In addition, the interaction between the costs for binary/discrete variables, h(zm 2 ), and the costs for the continuous output variables, h(zp), are correlated and highly nonlinear. In one embodiment, these problems are addressed by performing the optimization in two parts: a discrete component and continuous component. The set of all possible sequences of binary/discrete metric values is enumerated, including the null set. For computational efficiency, a subset of this set may be extracted. For each possible combination of binary/discrete values, a continuous optimization is performed using a general-purpose nonlinear optimizer, such as dynamic hill climbing or feasible sequential quadratic programming, to find the value of the input variable vector, zopt m, that minimizes the summed total cost of all input and output variables 
Optimizer II
In another embodiment, a heuristic optimization method designed to complement the embodiments described under Optimizer I is employed. The principal difference between the two techniques is in the weighting of the input-output variable listing. Optimizer II favors adjusting the variables that have the greatest individual impacts on the achievement of target output vector values, e.g., the target process metrics. Generally, Optimizer II achieves the specification ranges with a minimal number of input variables adjusted from the nominal. This is referred to as the “least labor alternative.” It is envisioned that when the optimization output of Optimizer II calls for adjustment of a subset of the variables adjusted using the embodiments of Optimizer I, these variables represent the principal subset involved with the achievement of the target process metric. The additional variable adjustments in the Optimization I algorithm may be minimizing overall cost through movement of the input variable into a lower cost region of operation.
In one embodiment, Optimization II proceeds as follows:
Min f(z)
zεΦ
s.t.h(z)=a
zL≦z≦z U
where Φ={zjεn: j≦sεI; an s vector set}.
f: n→ and h: n→n.
The index j refers to the jth vector of a total of s vectors of dimension n=m+p, the total number of input plus output variables, respectively, which is included in the set to be optimized by f. The determination of s discrete vectors from an original vector set containing both continuous and binary/discrete variables may be arrived at by initial creation of a discrete rate change from nominal partitioning. For each continuous variable, several different rate changes from the nominal value are formed. For the binary variables only two partitions are possible. For example, a continuous variable rate-change partition of −0.8 specifies reduction of the input variable by 80% from the current nominal value. The number of valid rate partitions for the m continuous variables is denoted as nm.
A vector z is included in Φ according to the following criterion. (The case is presented for continuous input variables, with the understanding that the procedure follows for the binary/discrete variables with the only difference that two partitions are possible for each binary variable, not nm.) Each continuous variable is individually changed from its nominal setting across all rate partition values while the remaining m−1 input variables are held at nominal value. The p output variables are computed from the inputs, forming z.
Inclusion of z within the set of vectors to be cost-optimized is determined by the degree to which the output variables approach targeted values. The notation zik (l)ε, l=1, 2, . . . p, refers to the lth output value obtained when the input variable vector is evaluated at nominal variable values with the exception of the ith input variable which is evaluated at its kth rate partition. In addition, zikε is the value of the ith input variable at its kth rate partition from nominal. The target value for the lth output variable l=1, 2, . . . p is target (l) and the lth output variable value for the nominal input vector values is denoted z0 (l).
The condition for accepting the specific variable at a specified rate change from nominal for inclusion in the optimization stage is as follows:
For each i≦m, and each k≦nm
if |(zik(l)−target(l))/(z0(l)−target(l)|<K(l)
for l≦p, 0≦K(l)≦1, and zL≦zi j≦zU
then zikεΔi=acceptable rate partitioned values of the ith input variable.
To each set Δi, i=1, . . . , m is added the ith nominal value. The final set Φ of n-dimension vectors is composed of the crossing of all the elements of the sets Δi of acceptable input variable rate-partitioned values from nominal. Thus, the total number of vectors zεΦ equals the product of the dimensions of the Δi: 
for
m1=the number of continuous input variables
m2=the number of binary and discrete variables.
The vector set Φ resembles a fully crossed main effects model which most aggressively approaches one or more of the targeted output values without violating the operating limits of the remaining output values.
This weighting strategy for choice of input vector construction generally favors minimal variable adjustments to reach output targets. In one embodiment, the Optimization II strategy seeks to minimize the weighted objective function 
for pV. The last p terms of z are the output variable values computed from the n inputs. The term 
is intended to help remove sensitivity to large-valued outliers. In this way, the approach favors the cost structure for which the majority of the output variables lie close to target, as compared to all variables being the same mean cost differential from target.
Values of pV>>3 represent weighting the adherence of the output variables to target values as more important than adjustments of input variables to lower cost structures that result in no improvement in quality.
In another embodiment, the Optimization II method seeks to minimize the weighted objective function 
for V. The last p terms of z are the output variable values computed from the n inputs.
In another aspect, the method of the invention comprises optimization of parameters from two different levels of a process (e.g., sub-process metrics and sub-process operational variables) against a parameter of a higher level (e.g., process metrics). Referring to FIG. 3, in one embodiment, the method provides a map between one or more metrics and operational variables of a sub-process and one or more process metrics 310. Preferably, the map serves as a nonlinear regression model trained in the relationship between A (the sub-process metrics and sub-process operational variables) and B (the process metrics) such that the nonlinear regression model can determine one or more predicted process metric values from one or more sub-process metric and sub-process operational variable values.
The sub-process metric, operational variable and process metric map 310, an optimization model 311 and a provided operational-variable cost function 315 are then used to determine target values for the sub-process metrics and target values for the sub-process operational variables 320 that are within a sub-process metric and sub-process operational variable constraint set 321, that produce at the lowest cost the process metric, and that are as close as possible to the target process metric values 323.
In addition, in various embodiments, the optimization method may further comprise measuring one or more sub-process metrics, one or more sub-process operational variables, or both 340, and adjusting one or more of the sub-process operational variables substantially to its associated target value 350.
In all the embodiments of the invention, the map between sub-process metrics and sub-process operational variables and the process metrics can be provided, for example, by determining the map through the training of a nonlinear regression model against measured sub-process metrics, sub-process operational variables and process metrics. The sub-process metrics and operational variables serve as the input to a nonlinear regression model, such as a neural network. The output of the nonlinear regression model is the process metric(s). The nonlinear regression model is preferably trained by comparing a calculated process metric(s), based on measured sub-process metrics and operational variables for an actual process run, with the actual process metric(s) as measured for the actual process run. The difference between the calculated and measured process metric(s), or the error, is used to compute the corrections to the adjustable parameters in the regression model. If the regression model is a neural network, these adjustable parameters are the connection weights between the layers of the neurons in the network.
In another aspect, the provides a method of compensating for a deviating sub-process in a sequence of sub-process by determining sub-process metrics for one or more downstream sub-processes (i.e., sub-processes later in the process sequence than the deviating sub-process) that may compensate for the deviating sub-process. FIGS. 4A-4C illustrate various embodiments of this aspect of the invention are shown. In one embodiment, the method comprises providing one or more target process metrics 411, a sub-process metric constraint set 412, a cost function for the sub-process metrics 413, and a map between one or more sub-process metrics 414 and one or more process metrics, where the sub-process and process metric map 414 and an optimizer 415 are used to determine values for the sub-process metrics 420 that are within the constraint set 412, and that produce at the lowest cost a process metric(s) that is as close as possible to the target process metric(s) 411 to define a target sub-process metric for each sub-process 420. The method proceeds with setting the metrics of each sub-process as close as possible to its target metrics 430. Once the sub-process metrics are set, if a substantial deviation in a sub-process metric is detected (“YES” to query 440), further action is undertaken.
Referring to FIG. 4B, detection of a substantial deviation in a sub-process metric defines the sub-process as a deviating sub-process 450. A deviating sub-process is any sub-process that exhibits a sub-process metric outside an acceptable range of values about a target value for the sub-process metric. The deviation may arise, for example, from a malfunction in the sub-process, an intentional change in the sub-process, and/or the inability of a sub-process, or process operator, to produce a sub-process metric within the acceptable range of values about a target value for the sub-process metric.
Once a deviating sub-process is found, values for the sub-process metrics of one or more of the sub-processes downstream of the deviating sub-process 460 are determined using the map 414, an optimizer 461 and a provided cost function 463, to define compensating target sub-process metric values for the one or more downstream sub-processes 460 based on one or more deviating sub-process metrics, where the compensating target sub-process metric values 460 are within a sub-process metric constraint set 465 and produce at the lowest cost a process metric(s) that is as close as possible to the target process metric(s) 411.
The method continues with providing a map between one or more downstream sub-process metrics and one or more operational variables of the associated downstream sub-process 470. The sub-process metric and operational variable map 470, an optimization model 473, and a provided operational variable cost function 475 are then used to determine target values for the downstream sub-process operational variables 480 that are within an operational variable constraint set 481, that produce at the lowest cost the sub-process metric, and that are as close as possible to the compensating target sub-process metric values.
In addition, in various embodiments, the optimization method may further comprise measuring one or more sub-process metrics, one or more sub-process operational variables, or both 490, and adjusting one or more of the sub-process operational variables substantially to its associated target value 495.
As in all embodiments of the invention, the map between one or more sub-process metrics and one or more sub-process operational variables preferably comprises a nonlinear regression model trained in the relationship between the sub-process metrics and sub-process operational variables such that the nonlinear regression model can determine one or more predicted sub-process metric values from one or more sub-process operational variable values. Similarly, the map between one or more sub-process metrics and one or more process metrics preferably comprises a nonlinear regression model trained in the relationship between the process metrics and sub-process metrics such that the nonlinear regression model can determine one or more predicted process metric values from one or more sub-process metric values.
In other aspects, the present invention provides systems adapted to practice the methods of the invention set forth above. Referring to FIG. 5, in one embodiment, the system comprises a process monitor 501 in electronic communication with a data processing device 505. The process monitor may comprise any device that provides information on variables, parameters, or process metrics of a process or sub-process. For example, the process monitor may comprise a RF power monitor for a sub-process tool 506. The data processing device may comprise an analog and/or digital circuit adapted to implement the functionality of one or more of the methods of the present invention using at least in part information provided by the process monitor. The information provided by the process monitor can be used, for example, to directly measure one or more metrics, operational variables, or both, associated with a process or sub-process. The information provided by the process monitor can also be used directly to train a non-linear regression model, implemented using data processing device 505 in a conventional manner, in the relationship between one or more of sub-process and process metrics, and sub-process metrics and sub-process operational variables (e.g., by using process parameter information as values for variables in an input vector and metrics as values for variables in a target output vector) or used to construct training data set for later use. In addition, in one embodiment, the systems of the present invention are adapted to conduct continual, on-the-fly training of the non-linear regression model.
In another embodiment, the system further comprises a process tool controller 509 in electronic communication with the data processing device 505. The process tool controller may be any device capable of adjusting one or more process or sub-process operational variables in response to a control signal from the data processing device. The process controller may comprise mechanical and/or electromechanical mechanisms to change the operational variables. Alternatively, the process controller may simply comprise a display that alerts a human operator to the desired operational variable values and who in turn effectuates the change. For example, the process tool controller may comprise a circuit board that controls the RF power supply of a process tool 506.
In some embodiments, the data processing device may implement the functionality of the methods of the present invention as software on a general purpose computer. In addition, such a program may set aside portions of a computer's random access memory to provide control logic that affects one or more of the measuring of metrics, the measuring of operational variables, the provision of target metric values, the provision of constraint sets, the prediction of metrics, the determination of metrics, the implementation of an optimizer, determination of operational variables, and detecting deviations of or in a metric. In such an embodiment, the program may be written in any one of a number of high-level languages, such as FORTRAN, PASCAL, C, C++, Tcl, or BASIC. Further, the program can be written in a script, macro, or functionality embedded in commercially available software, such as EXCEL or VISUAL BASIC. Additionally, the software could be implemented in an assembly language directed to a microprocessor resident on a computer. For example, the software can be implemented in Intel 80x86 assembly language if it is configured to run on an IBM PC or PC clone. The software may be embedded on an article of manufacture including, but not limited to, “computer-readable program means” such as a floppy disk, a hard disk, an optical disk, a magnetic tape, a PROM, an EPROM, or CD-ROM.
In another aspect, the present invention provides an article of manufacture where the functionality of a method of the present invention is embedded on a computer-readable medium, such as, but not limited to, a floppy disk, a hard disk, an optical disk, a magnetic tape, a PROM, an EPROM, CD-ROM, or DVD-ROM. The functionality of the method may be embedded on the computer-readable medium in any number of computer-readable instructions, or languages such as, for example, FORTRAN, PASCAL, C, C++, Tcl, BASIC and assembly language. Further, the computer-readable instructions can, for example, be written in a script, macro, or functionally embedded in commercially available software (such as, e.g., EXCEL or VISUAL BASIC).
An illustrative description of the invention in the context of a metalization process utilized in the production of integrated circuits is provided below. However, it is to be understood that the present invention may be applied to any integrated circuit production process including, but not limited to, plasma etch processes and via formation processes. More generally, it should be realized that the present invention is generally applicable to any complex multi-step production processes, such as, for example, circuit board assembly, automobile assembly and petroleum refining.
The following example pertains to a metalization layer process utilized during the manufacture of integrated circuits. Examples of input variables for a non-linear regression model of a metalization process or sub-process are listed in the following Table 1, and include sub-process operational variables “process variables” and “maintenance variables” columns, and sub-process metrics, “metrology variables” column. Examples of output variables for a non-linear regression model of a metalization process or sub-process are also listed in Table 1, which include sub-process metrics, “metrology variables” column, and process metrics “yield metric” column.
| TABLE 1 | |||
| output | |||
| input variables | variable | ||
| maintenance | yield | ||
| process variables | variables | metrology variables | metric |
| cvd tool id | cvd tool mfc1 | cvd control wafer | via chain |
| resistance | |||
| cvd tool pressure | cvd tool mfc2 | cmp control wafer | |
| cvd tool gas flow | cvd tool mfc3 | cmp product wafer | |
| cvd tool | cvd tool electrode | litho/pr control | |
| termperature | wafer | ||
| cvd tool . . . | cvd tool up time | litho/pr product | |
| wafer | |||
| cmp tool id | cmp tool pad | etch control wafer | |
| cmp tool speed | cmp tool slurry | etch product wafer | |
| cmp tool slurry | cmp pad moter | ||
| cmp tool | cmp calibration | ||
| temperature | |||
| cmp tool . . . | cmp tool up time | ||
| litho tool id | litho tool lamp | ||
| litho tool x,y,z | litho tool | ||
| calibration | |||
| litho tool . . . | litho tool up time | ||
| etch tool id | etch tool electrode | ||
| etch tool pressure | etch tool mfc1 | ||
| etch tool rf power | etch tool mfc2 | ||
| etch tool gas flow | etch tool clamp ring | ||
| etch tool | etch tool rf match | ||
| temperature | box | ||
| etch tool . . . | etch tool up time | ||
Prior to the first layer of metalization, the transistors 601 are manufactured and a first level of interconnection 603 is prepared. This is shown schematically in FIG. 6. The details of the transistor structures and the details of the metal runners (first level of interconnect) are not shown.
The first step in the manufacture of integrated circuits is typically to prepare the transistors 601 on the silicon wafer 605. The nearest neighbors that need to be connected are then wired up with the first level of interconnection 603. Generally, not all nearest neighbors are connected; the connections stem from the circuit functionality. After interconnection, the sequential metalization layers, e.g., a first layer 607, a second layer 609, a third layer 611, etc., are fabricated where the metalization layers are separated by levels of oxide 613 and interconnected by vias 615.
FIG. 7 schematically illustrates four sequential processing steps 710, i.e., sub-processes, that are associated with manufacturing a metal layer (i.e., the metalization layer process). These four processing steps are: (1) oxide deposition 712; (2) chemical mechanical planerization 714; (3) lithography 716; and (4) via etch 718. Also illustrated are typical associated sub-process metrics 720.
Oxide deposition, at this stage in integrated circuit manufacture, is typically accomplished using a process known as PECVD (plasma-enhanced chemical vapor deposition), or simply CVD herein. Typically, during the oxide deposition sub-process 712 a blank monitor wafer (also known as a blanket wafer) is run with each batch of silicon wafers. This monitor wafer is used to determine the amount of oxide deposited on the wafer. Accordingly, on a lot to lot basis there are typically one or more monitor wafers providing metrology data (i.e., metrics for the sub-process) on the film thickness, as grown, on the product wafer. This film thickness 722 is a metric of the oxide-deposition sub-process.
After the oxide-deposition sub-process, the wafers are ready for the chemical mechanical planarization (“CMP”) processing step 714. This processing step is also referred to as chemical mechanical polishing. CMP is a critical sub-process because after the growth of the oxide, the top surface of the oxide layer takes on the underlying topology. Generally, if this surface is not smoothed the succeeding layers will not match directly for subsequent processing steps. After the CMP sub-process, a film thickness may be measured from a monitor wafer or, more commonly, from product wafers. Frequently, a measure of the uniformity of the film thickness is also obtained. Accordingly, film thickness and film uniformity 724 are in this example the metrics of the CMP sub-process.
Following the CMP sub-process is the lithography processing step 716, in which a photoresist is spun-on the wafer, patterned, and developed. The photoresist pattern defines the position of the vias, i.e., tiny holes passing directly through the oxide layer. Vias facilitate connection among transistors and metal traces on different layers. This is shown schematically in FIG. 6. Typically, metrics of the lithography sub-process may include the photoresist set-up parameters 726.
The last sub-process shown in FIG. 7 is the via etch sub-process 718. This is a plasma etch designed to etch tiny holes through the oxide layer. The metal interconnects from layer to layer are then made. After the via etch, film thickness measurements indicating the degree of etch are typically obtained. In addition, measurements of the diameter of the via hole, and a measurement of any oxide or other material in the bottom of the hole, may also be made. Thus, in this example, two of these measurements, film thickness and via hole profile 728, are used as the via etch sub-process metrics.
Not shown in FIG. 7 (or FIG. 8) is the metal deposition processing step. The metal deposition sub-process comprises sputter deposition of a highly conductive metal layer. The end result can be, for example, the connectivity shown schematically in FIG. 6. (The metal deposition sub-process is not shown to illustrate that not every sub-process of a given process need be considered to practice and obtain the objectives of the present invention. Instead, only a certain subset of the sub-processes may be used to control and predict the overall process.)
Each metal layer is prepared by repeating these same sub-process steps. Some integrated microelectronic chips contain six or more metal layers. The larger the metal stack, the more difficult it is to manufacture the devices.
When the wafers have undergone a metalization layer process, they are typically sent to a number of stations for testing and evaluation. Commonly, during each of the metalization layer processes there are also manufactured on the wafer tiny structures known as via-chain testers or metal-to-metal resistance testers. The via chain resistance 752 measured using these structures represents the process metric of this example. This process metric, also called a yield metric, is indicative of the performance of the cluster of processing steps, i.e., sub-processes. Further, with separate via-chain testers for each metalization layer process, the present invention can determine manufacturing faults at individual clusters of sub-processes.
In one embodiment, the sub-process metrics from each of the sub-processes (processing steps) become the input to a nonlinear regression model 760. The output for this model is the calculated process metric 762; in the present example, this is the via-chain resistance. The nonlinear regression model is trained as follows.
The model calculates a via-chain resistance 762 using the input sub-process metrics 720. The calculated via chain resistance 762 is compared 770 with the actual resistance 752 as measured during the wafer-testing phase. The difference, or the error, 780 is used to compute corrections to the adjustable parameters in the regression model 760. The procedure of calculation, comparison, and correction is repeated with other training sets of input and output data until the error of the model reaches an acceptable level. An illustrative example of such a training scheme is shown schematically in FIG. 7.
After the nonlinear regression model, or neural network, is trained it is ready for optimization of the sub-process metrics. FIG. 8 schematically illustrates the optimization of the sub-process metrics 720 with an “optimizer” 801. The optimizer 801 operates according to the principles hereinabove described, determining target sub-process metrics 811 that are within the constraint set 813 and are predicted to achieve a process metric(s) as close to the target process metric(s) 815 as possible while maintaining the lowest cost feasible. The optimization procedure begins by setting an acceptable range of values for the sub-process metrics to define a sub-process metric constraint set 813 and by setting one or more target process metrics 815. The optimization procedure then optimizes the sub-process metrics against a cost function for the sub-process metrics.
For example, in the metalization layer process, the constraint set 813 could comprise minimum and maximum values for the oxide deposition film thickness metric, the CMP film thickness and film uniformity metrics, the lithography photoresist set up parameters, and the via etch hole profile and film thickness metrics. The target process metric, via chain resistance 815, is set at a desired value, e.g., zero. After the nonlinear regression model 760 is trained, the optimizer 801 is run to determine the values of the various sub-process metrics (i.e., target sub-process metrics 811) that are predicted to produce a via chain resistance as close as possible to the target value 815 (i.e., zero) at the lowest cost.
Referring to FIG. 8, in another embodiment, an additional level of prediction and control is employed. This additional level of prediction and control is illustrated in FIG. 8 by the loop arrows labeled “feedback control loop” 830. In one such embodiment, a map is determined between the operational variables of a sub-process and the metrics of that sub-process, and a cost function is provided for the sub-process operational variables. Employing the map and cost function, values for the sub-process operational variables are determined that produce at the lowest cost the sub-process metric, and that are as close as possible to the target sub-process metric values, to define target operational variables. In another embodiment, an acceptable range of values for the sub-process operational variables is identified to define a sub-process operational variable constraint set, and the operational variables are then optimized such that the target operational variables fall within the constraint set.
In one embodiment, the optimization method comprises a genetic algorithm. In another embodiment, the optimization is as for Optimizer I described above. In another embodiment, the optimization is as for Optimizer II described above. In yet another embodiment, the optimization strategies of Optimization I are utilized with the vector selection and pre-processing strategies of Optimization II.
FIG. 9 schematically illustrates an embodiment of the invention, in the context of the present metalization layer process example, that comprises determining a map between the sub-process metrics and sub-process operational variables and the process metrics using a nonlinear regression model. As illustrated, the input variables 910 to the nonlinear regression model 760 comprise both process metrics 912 and sub-process operational variables 914, 916.
FIG. 9 further illustrates that in this embodiment, the optimizer 920 acts on both the sub-process metrics and operational parameters to determine values for the sub-process metrics and operational variables that are within the constraint set, and that produce at the lowest cost a process metric(s) 752 that is as close as possible to the a target process metric(s) to define target sub-process metrics and target operational variables for each sub-process.
Referring to FIGS. 10 and 11, and the metalization layer process described above, one embodiment of the present invention comprises a hierarchical series of sub-process and process models. As seen in FIG. 6, there are several levels of metalization. As illustrated in FIG. 10, a new model is formed where each metalization layer process performed, such as illustrated in FIGS. 7 and 8, becomes a sub-process 1010 in a new higher level process, i.e., complete metalization in this example. As illustrated in FIGS. 10 and 11, the sub-process metrics 1020 are the via chain resistances of a given metalization layer process, and the process metrics of the complete metalization process are the IV (current-voltage) parameters 1030 of the wafers. FIG. 10 provides an illustrative schematic of training the nonlinear regression model 1060 for the new higher level process, and FIG. 11 illustrates its use in optimization.
Referring to FIG. 10, the nonlinear regression model 1060 is trained in the relationship between the sub-process metrics 1020 and process metric(s) 1030 in a manner analogous to that illustrated in FIG. 7. The sub-process metrics 1020 from each of the sub-processes 1010 (here metalization steps) become the input to the nonlinear regression model 1060. The output for this model is the calculated process metrics 1062; in the present example, these are the IV parameters. The nonlinear regression model is trained as follows.
The model calculates IV parameters 1062 using the input sub-process metrics 1020. The calculated IV parameters 1062 are compared as indicated at 1070 with the actual IV parameters as measured during the wafer-testing phase 1030. The difference, or the error, 1080 is used to compute corrections to the adjustable parameters in the regression model 1060. The procedure of calculation, comparison, and correction is repeated with other training sets of input and output data until the error of the model reaches an acceptable level.
Referring again to FIG. 11, after the nonlinear regression model, or neural network, 1060 is trained it is ready for optimization of the sub-process metrics 1020 in connection with an “optimizer” 1101. The optimizer 1101 determines target sub-process metrics 1111 that are within the constraint set 1113 and are predicted to achieve a process metric(s) as close to the target process metric(s) 1115 as possible while maintaining the lowest cost feasible. The optimization procedure begins by setting an acceptable range of values for the sub-process metrics to define a sub-process metric constraint set 1113 and by setting one or more target process metrics 1115. The optimization procedure then optimizes the sub-process metrics against a cost function for the sub-process metrics.
For example, in the overall metalization process, the constraint set 1113 may comprise minimum and maximum values for the via chain resistances of the various metal layers. The target process metric, IV parameters, 1115 are set to desired values and the optimizer 1101 is run to determine the values of the various sub-process metrics (i.e., target sub-process metrics 1111) that are predicted to produce IV parameters as close as possible (e.g., in a total error sense) to the target value 1115 at the lowest cost.
In another embodiment, an additional level of prediction and control is employed. This additional level of prediction and control is illustrated in FIG. 11 by the feedback control loop arrows 1130. In one such embodiment, a map is determined between the operational variables of a sub-process and the metrics of that sub-process, and a cost function is provided for the sub-process operational variables, which in this example may also be the operational variables of a sub-sub-process. Employing the map and cost function, values for the sub-process operational variables are determined that produce at the lowest cost the sub-process metric, and that are as close as possible to the target sub-process metric values, to define target operational variables. In another embodiment, an acceptable range of values for the sub-process operational variables is identified to define a sub-process operational variable constraint set, and the operational variables are then optimized such that the target operational variables fall within the constraint set.
While the invention has been particularly shown and described with reference to specific embodiments, it should be understood by those skilled in the art that various changes in form and detail may be made therein without departing from the spirit and scope of the invention as defined by the appended claims. The scope of the invention is thus indicated by the appended claims and all changes which come within the meaning and range of equivalency of the claims are therefore intended to be embraced.
Claims (27)
1. A method of optimization of a process having an associated metric and comprising a plurality of sub-processes, the method comprising the steps of:
(a) providing a target metric value for the process;
(b) providing one or more ranges of acceptable values for the sub-process metrics to define a constraint set;
(c) providing a nonlinear regression model that has been trained in the relationship between the sub-process metrics and the process metric such that the nonlinear regression model can determine a predicted process metric value from the measured sub-process metric values; and
(d) using the nonlinear regression model and an optimizer to determine values for the sub-process metrics within the constraint set that produce at a substantially lowest cost a predicted process metric value substantially as close as possible to the target process metric value.
2. The method of claim 1 , further comprising the step of:
repeating steps (a)-(d) for a sub-process of the process, wherein said sub-process becomes the process and one or more sub-sub-processes of said sub-process become the sup-processes of steps (a)-(d).
3. The method of claim 1 , further comprising the step of:
repeating steps (a)-(d) for a higher level process of comprising a plurality of the processes of claim 1 , wherein said higher level process becomes the process and one or more of the plurality of the processes of claim 1 become the sup-processes of steps (a)-(d).
4. The method of claim 1 , wherein the optimizer associates costs with at least one of the sub-process metrics.
5. The method of claim 1 , further comprising the steps of:
(e) providing one or more target sub-process metric values for a sub-process, the target sub-process metric values producing at a substantially lowest cost a predicted process metric value substantially as close as possible to the target process metric value;
(f) providing one or more ranges of acceptable values for the sub-process operational variables to define an operational variable constraint set;
(g) providing a nonlinear regression model that has been trained in the relationship between the sub-process operational variables and the sub-process metrics of said sub-process such that the nonlinear regression model can determine a predicted sub-process metric value for said sub-process from the sub-process operational variable values; and
(h) using the nonlinear regression model and an optimizer to determine target values for the sub-process operational variables within the operational variable constraint set that produce at a substantially lowest cost a predicted sub-process metric for said sub-process as close as possible to the target sub-process metric for said sub-process.
6. The method of claim 5 , further comprising the step of:
repeating steps (e)-(h) for another sub-process of the process.
7. The method of claim 5 , wherein the optimizer associates costs with at least one of the sub-process operational variables.
8. The method of claim 5 , further comprising the steps of:
(i) measuring at least one of one or more sub-process metrics and one or more sub-process operational variables; and
(j) adjusting one or more sub-process operational variables as close as possible to a target value for the sub-process operational variable.
9. The method of claim 8 , further comprising the step of:
repeating steps (i)-(j) for another sub-process of the process.
10. An article of manufacture having a computer-readable medium with computer-readable instructions embodied thereon for performing the method of claim 5 .
11. The method of claim 1 , wherein the action of providing of at least one of steps (a) and (b) comprises measuring.
12. An article of manufacture having a computer-readable medium with computer-readable instructions embodied thereon for performing the method of claim 1 .
13. A method of optimization of a process having an associated metric and comprising a plurality of sub-processes, the method comprising the steps of:
(a) providing a target metric value for the process;
(b) providing one or more ranges of acceptable values for the sub-process metrics and the sub-process operational variables to define a sub-process constraint set;
(c) providing a nonlinear regression model that has been trained in the relationship between the sub-process metrics and sub-process operational variables and the process metric such that the nonlinear regression model can determine a predicted process metric value from the measured sub-process metric and operational variable values; and
(d) using the nonlinear regression model and an optimizer to determine values for the sub-process metrics and the sub-process operational variables within the sub-process constraint set that produce at a substantially lowest cost a predicted process metric substantially as close as possible to the target process metric.
14. The method of claim 13 , wherein the optimizer associates costs with at least one of the sub-process metrics and at least one of the sub-process operational variables.
15. The method of claim 13 , further comprising the step of:
repeating steps (a)-(d) for another sub-process of the process.
16. The method of claim 13 , further comprising the steps of:
(e) measuring at least one of one or more sub-process metrics and one or more sub-process operational variables; and
(f) adjusting one or more sub-process operational variables as close as possible to a target value for the sub-process operational variable.
17. The method of claim 15 , further comprising the step of:
repeating steps (e)-(f) for another sub-process of the process.
18. An article of manufacture having a computer-readable medium with computer-readable instructions embodied thereon for performing the method of claim 13 .
19. A method of compensating for sub-process deviation from an acceptable range about a target metric, the method comprising the steps of:
(a) providing a target metric value for a metric associated with a process, the process comprising a sequence of sub-processes;
(b) providing a target sub-process metric value for a metric associated with a sub-process of the process;
(c) providing one or more ranges of acceptable values for the sub-process metrics to define a constraint set;
(d) detecting a substantial deviation in at least one sub-process metric value of one sub-process from the target sub-process metric value for said sub-process that defines a deviating sub-process;
(e) providing a nonlinear regression model that has been trained in the relationship between the sub-process metrics and the process metric such that the nonlinear regression model can determine a predicted process metric value based on the sub-process metric value of the deviating sub-process; and
(f) using the nonlinear regression model and an optimizer to determine values for the sub-process metrics of sub-processes that are later in the process sequence than the deviating sub-process, wherein said values are within the constraint set and produce at a substantially lowest cost a predicted process metric value substantially as close as possible to the target process metric value.
20. The method of claim 19 , wherein step (b) comprises:
providing a target metric value for a metric associated with a process, the process comprising a sequence of sub-processes;
providing a nonlinear regression model that has been trained in the relationship between the sub-process metrics and the process metric such that the nonlinear regression model can determine a predicted process metric value based on the sub-process metric value of the deviating sub-process; and
using the nonlinear regression model and an optimizer to determine values for the sub-process metrics of sub-processes to define target sub-process metric values, wherein said values are within a constraint set and produce at a substantially lowest cost a predicted process metric value substantially as close as possible to the target process metric value.
21. The method of claim 19 , wherein the values for the sub-process metrics of sub-processes that are later in the process sequence than the deviating sub-process of step (f) define compensating target sub-process metric values; and the method further comprises the steps of:
(g) providing one or more ranges of acceptable values for one or more sub-process operational variables to define an operational variable constraint set;
(h) providing a nonlinear regression model that has been trained in the relationship between one ore more of the sub-process operational variables and the sub-process metrics of said sub-process such that the nonlinear regression model can determine a predicted sub-process metric value for said sub-process from the sub-process operational variable values; and
(i) using the nonlinear regression model and an optimizer to determine target values for one or more of the sub-process operational variables within the operational variable constraint set that produce at a substantially lowest cost a predicted sub-process metric for said sub-process as close as possible to the compensating target sub-process metric value for said sub-process.
22. The method of claim 21 , further comprising the steps of:
(j) measuring at least one of one or more sub-process metrics and one or more sub-process operational variables; and
(k) adjusting one or more sub-process operational variables as close as possible to the target value for the sub-process operational variable.
23. The method of claim 19 , wherein the optimizer associates costs with at least one of the sub-process operational variables.
24. An article of manufacture having a computer-readable medium with computer-readable instructions embodied thereon for performing the method of claim 19 .
25. A data processing device for optimizing a process having an associated metric and comprising a plurality of sub-processes, the device receiving a target metric value for the process and one or more ranges of acceptable values for the sub-process metrics to define a constraint set, and executing a nonlinear regression model that has been trained in the relationship between the sub-process metrics and the process metric such that the nonlinear regression model can determine a predicted process metric value from the measured sub-process metric values, the device being configured to use the nonlinear regression model and an optimizer to determine values for the sub-process metrics within the constraint set that produce at a substantially lowest cost a predicted process metric value substantially as close as possible to the target process metric value.
26. A data processing device for optimizing a process having an associated metric and comprising a plurality of sub-processes, the device receiving a target metric value for the process and one or more ranges of acceptable values for the sub-process metrics and the sub-process operational variables to define a sub-process constraint set, and executing a nonlinear regression model that has been trained in the relationship between the sub-process metrics and sub-process operational variables and the process metric such that the nonlinear regression model can determine a predicted process metric value from the measured sub-process metric and operational variable values, the device being configured to use the nonlinear regression model and an optimizer to determine values for the sub-process metrics and the sub-process operational variables within the sub-process constraint set that produce at a substantially lowest cost a predicted process metric substantially as close as possible to the target process metric.
27. A data processing device for compensating for sub-process deviation from an acceptable range about a target metric, the device receiving (i) a target metric value for a metric associated with a process, the process comprising a sequence of sub-processes, (ii) a target sub-process metric value for a metric associated with a sub-process of the process, and (iii) one or more ranges of acceptable values for the sub-process metrics to define a constraint set, the device detecting a substantial deviation in at least one sub-process metric value of one sub-process from the target sub-process metric value for said sub-process that defines a deviating sub-process and comprising a nonlinear regression model that has been trained in the relationship between the sub-process metrics and the process metric such that the nonlinear regression model can determine a predicted process metric value based on the sub-process metric value of the deviating sub-process, the device being configured to use the nonlinear regression model and an optimizer to determine values for the sub-process metrics of sub-processes that are later in the process sequence than the deviating sub-process, wherein said values are within the constraint set and produce at a substantially lowest cost a predicted process metric value substantially as close as possible to the target process metric value.
Priority Applications (1)
| Application Number | Priority Date | Filing Date | Title |
|---|---|---|---|
| US10/243,963 US6810291B2 (en) | 2001-09-14 | 2002-09-13 | Scalable, hierarchical control for complex processes |
Applications Claiming Priority (2)
| Application Number | Priority Date | Filing Date | Title |
|---|---|---|---|
| US32240601P | 2001-09-14 | 2001-09-14 | |
| US10/243,963 US6810291B2 (en) | 2001-09-14 | 2002-09-13 | Scalable, hierarchical control for complex processes |
Publications (2)
| Publication Number | Publication Date |
|---|---|
| US20030083757A1 US20030083757A1 (en) | 2003-05-01 |
| US6810291B2 true US6810291B2 (en) | 2004-10-26 |
Family
ID=23254744
Family Applications (1)
| Application Number | Title | Priority Date | Filing Date |
|---|---|---|---|
| US10/243,963 Expired - Fee Related US6810291B2 (en) | 2001-09-14 | 2002-09-13 | Scalable, hierarchical control for complex processes |
Country Status (2)
| Country | Link |
|---|---|
| US (1) | US6810291B2 (en) |
| WO (1) | WO2003025685A1 (en) |
Cited By (96)
| Publication number | Priority date | Publication date | Assignee | Title |
|---|---|---|---|---|
| US20040076944A1 (en) * | 2002-08-22 | 2004-04-22 | Ibex Process Technology, Inc. | Supervised learning in the presence of null data |
| US20050130329A1 (en) * | 2003-12-16 | 2005-06-16 | Yushan Liao | Method for the prediction of the source of semiconductor part deviations |
| US20050171730A1 (en) * | 2004-01-30 | 2005-08-04 | Tokyo Electron Limited | Method and system for monitoring component consumption |
| US20060036345A1 (en) * | 2004-08-09 | 2006-02-16 | An Cao | Systems and method for lights-out manufacturing |
| US20060178999A1 (en) * | 2005-02-10 | 2006-08-10 | Rust Langbourne W | Fee determination device |
| US20070038417A1 (en) * | 2005-07-28 | 2007-02-15 | Taiwan Semiconductor Manufacturing Company, Ltd. | Regression system and methods for optical proximity correction modeling |
| US20070240160A1 (en) * | 2006-03-31 | 2007-10-11 | Amazon Technologies, Inc. | Managing execution of programs by multiple computing systems |
| US20080059557A1 (en) * | 2006-03-31 | 2008-03-06 | Desantis Peter N | Executing programs based on user-specified constraints |
| US20100100216A1 (en) * | 2007-04-19 | 2010-04-22 | Ames Ii Daniel E | Multiple product, multiple step optimization methods |
| US20130110262A1 (en) * | 2011-10-28 | 2013-05-02 | Agilent Technologies, Inc. | Automatic tuning of atomic force microscope |
| US8495220B2 (en) | 2008-11-17 | 2013-07-23 | Amazon Technologies, Inc. | Managing CDN registration by a storage provider |
| US8510448B2 (en) | 2008-11-17 | 2013-08-13 | Amazon Technologies, Inc. | Service provider registration by a content broker |
| US8521885B1 (en) | 2009-03-27 | 2013-08-27 | Amazon Technologies, Inc. | Dynamically translating resource identifiers for request routing using popularity information |
| US8521851B1 (en) | 2009-03-27 | 2013-08-27 | Amazon Technologies, Inc. | DNS query processing using resource identifiers specifying an application broker |
| US8533293B1 (en) | 2008-03-31 | 2013-09-10 | Amazon Technologies, Inc. | Client side cache management |
| US8543702B1 (en) | 2009-06-16 | 2013-09-24 | Amazon Technologies, Inc. | Managing resources using resource expiration data |
| US8577992B1 (en) | 2010-09-28 | 2013-11-05 | Amazon Technologies, Inc. | Request routing management based on network components |
| US8583776B2 (en) | 2008-11-17 | 2013-11-12 | Amazon Technologies, Inc. | Managing content delivery network service providers |
| US8601090B1 (en) | 2008-03-31 | 2013-12-03 | Amazon Technologies, Inc. | Network resource identification |
| US8606996B2 (en) | 2008-03-31 | 2013-12-10 | Amazon Technologies, Inc. | Cache optimization |
| US8626950B1 (en) | 2010-12-03 | 2014-01-07 | Amazon Technologies, Inc. | Request routing processing |
| US8639817B2 (en) | 2008-03-31 | 2014-01-28 | Amazon Technologies, Inc. | Content management |
| US8676918B2 (en) | 2010-09-28 | 2014-03-18 | Amazon Technologies, Inc. | Point of presence management in request routing |
| US8713156B2 (en) | 2008-03-31 | 2014-04-29 | Amazon Technologies, Inc. | Request routing based on class |
| US8732309B1 (en) | 2008-11-17 | 2014-05-20 | Amazon Technologies, Inc. | Request routing utilizing cost information |
| US8756341B1 (en) | 2009-03-27 | 2014-06-17 | Amazon Technologies, Inc. | Request routing utilizing popularity information |
| US8788671B2 (en) | 2008-11-17 | 2014-07-22 | Amazon Technologies, Inc. | Managing content delivery network service providers by a content broker |
| US8819283B2 (en) | 2010-09-28 | 2014-08-26 | Amazon Technologies, Inc. | Request routing in a networked environment |
| US8924528B1 (en) | 2010-09-28 | 2014-12-30 | Amazon Technologies, Inc. | Latency measurement in resource requests |
| US8930513B1 (en) | 2010-09-28 | 2015-01-06 | Amazon Technologies, Inc. | Latency measurement in resource requests |
| US8938526B1 (en) | 2010-09-28 | 2015-01-20 | Amazon Technologies, Inc. | Request routing management based on network components |
| US9003035B1 (en) | 2010-09-28 | 2015-04-07 | Amazon Technologies, Inc. | Point of presence management in request routing |
| US9003040B2 (en) | 2010-11-22 | 2015-04-07 | Amazon Technologies, Inc. | Request routing processing |
| US9009286B2 (en) | 2008-03-31 | 2015-04-14 | Amazon Technologies, Inc. | Locality based content distribution |
| US9021128B2 (en) | 2008-06-30 | 2015-04-28 | Amazon Technologies, Inc. | Request routing using network computing components |
| US9021129B2 (en) | 2007-06-29 | 2015-04-28 | Amazon Technologies, Inc. | Request routing utilizing client location information |
| US9021127B2 (en) | 2007-06-29 | 2015-04-28 | Amazon Technologies, Inc. | Updating routing information based on client location |
| US9026616B2 (en) | 2008-03-31 | 2015-05-05 | Amazon Technologies, Inc. | Content delivery reconciliation |
| US9083743B1 (en) | 2012-03-21 | 2015-07-14 | Amazon Technologies, Inc. | Managing request routing information utilizing performance information |
| US9130756B2 (en) | 2009-09-04 | 2015-09-08 | Amazon Technologies, Inc. | Managing secure content in a content delivery network |
| US9135048B2 (en) | 2012-09-20 | 2015-09-15 | Amazon Technologies, Inc. | Automated profiling of resource usage |
| US9154551B1 (en) | 2012-06-11 | 2015-10-06 | Amazon Technologies, Inc. | Processing DNS queries to identify pre-processing information |
| US9237114B2 (en) | 2009-03-27 | 2016-01-12 | Amazon Technologies, Inc. | Managing resources in resource cache components |
| US9246776B2 (en) | 2009-10-02 | 2016-01-26 | Amazon Technologies, Inc. | Forward-based resource delivery network management techniques |
| US9251112B2 (en) | 2008-11-17 | 2016-02-02 | Amazon Technologies, Inc. | Managing content delivery network service providers |
| US9253211B2 (en) | 2006-03-31 | 2016-02-02 | Amazon Technologies, Inc. | Managing communications between computing nodes |
| US9288153B2 (en) | 2010-08-26 | 2016-03-15 | Amazon Technologies, Inc. | Processing encoded content |
| US9294391B1 (en) | 2013-06-04 | 2016-03-22 | Amazon Technologies, Inc. | Managing network computing components utilizing request routing |
| US9323577B2 (en) | 2012-09-20 | 2016-04-26 | Amazon Technologies, Inc. | Automated profiling of resource usage |
| US9391949B1 (en) | 2010-12-03 | 2016-07-12 | Amazon Technologies, Inc. | Request routing processing |
| US9407681B1 (en) | 2010-09-28 | 2016-08-02 | Amazon Technologies, Inc. | Latency measurement in resource requests |
| US9479476B2 (en) | 2008-03-31 | 2016-10-25 | Amazon Technologies, Inc. | Processing of DNS queries |
| US9495338B1 (en) | 2010-01-28 | 2016-11-15 | Amazon Technologies, Inc. | Content distribution network |
| US9525659B1 (en) | 2012-09-04 | 2016-12-20 | Amazon Technologies, Inc. | Request routing utilizing point of presence load information |
| US9628554B2 (en) | 2012-02-10 | 2017-04-18 | Amazon Technologies, Inc. | Dynamic content delivery |
| US9712484B1 (en) | 2010-09-28 | 2017-07-18 | Amazon Technologies, Inc. | Managing request routing information utilizing client identifiers |
| US9742795B1 (en) | 2015-09-24 | 2017-08-22 | Amazon Technologies, Inc. | Mitigating network attacks |
| US9774619B1 (en) | 2015-09-24 | 2017-09-26 | Amazon Technologies, Inc. | Mitigating network attacks |
| US9787775B1 (en) | 2010-09-28 | 2017-10-10 | Amazon Technologies, Inc. | Point of presence management in request routing |
| US9794281B1 (en) | 2015-09-24 | 2017-10-17 | Amazon Technologies, Inc. | Identifying sources of network attacks |
| US9819567B1 (en) | 2015-03-30 | 2017-11-14 | Amazon Technologies, Inc. | Traffic surge management for points of presence |
| US9832141B1 (en) | 2015-05-13 | 2017-11-28 | Amazon Technologies, Inc. | Routing based request correlation |
| US9887931B1 (en) | 2015-03-30 | 2018-02-06 | Amazon Technologies, Inc. | Traffic surge management for points of presence |
| US9887932B1 (en) | 2015-03-30 | 2018-02-06 | Amazon Technologies, Inc. | Traffic surge management for points of presence |
| US9912740B2 (en) | 2008-06-30 | 2018-03-06 | Amazon Technologies, Inc. | Latency measurement in resource requests |
| US9992086B1 (en) | 2016-08-23 | 2018-06-05 | Amazon Technologies, Inc. | External health checking of virtual private cloud network environments |
| US10021179B1 (en) | 2012-02-21 | 2018-07-10 | Amazon Technologies, Inc. | Local resource delivery network |
| US10033691B1 (en) | 2016-08-24 | 2018-07-24 | Amazon Technologies, Inc. | Adaptive resolution of domain name requests in virtual private cloud network environments |
| US10033627B1 (en) | 2014-12-18 | 2018-07-24 | Amazon Technologies, Inc. | Routing mode and point-of-presence selection service |
| US10049051B1 (en) | 2015-12-11 | 2018-08-14 | Amazon Technologies, Inc. | Reserved cache space in content delivery networks |
| US10075551B1 (en) | 2016-06-06 | 2018-09-11 | Amazon Technologies, Inc. | Request management for hierarchical cache |
| US10091096B1 (en) | 2014-12-18 | 2018-10-02 | Amazon Technologies, Inc. | Routing mode and point-of-presence selection service |
| US10097448B1 (en) | 2014-12-18 | 2018-10-09 | Amazon Technologies, Inc. | Routing mode and point-of-presence selection service |
| US10097566B1 (en) | 2015-07-31 | 2018-10-09 | Amazon Technologies, Inc. | Identifying targets of network attacks |
| US10110694B1 (en) | 2016-06-29 | 2018-10-23 | Amazon Technologies, Inc. | Adaptive transfer rate for retrieving content from a server |
| US10205698B1 (en) | 2012-12-19 | 2019-02-12 | Amazon Technologies, Inc. | Source-dependent address resolution |
| US10225326B1 (en) | 2015-03-23 | 2019-03-05 | Amazon Technologies, Inc. | Point of presence based data uploading |
| US10257307B1 (en) | 2015-12-11 | 2019-04-09 | Amazon Technologies, Inc. | Reserved cache space in content delivery networks |
| US10270878B1 (en) | 2015-11-10 | 2019-04-23 | Amazon Technologies, Inc. | Routing for origin-facing points of presence |
| US10348639B2 (en) | 2015-12-18 | 2019-07-09 | Amazon Technologies, Inc. | Use of virtual endpoints to improve data transmission rates |
| US10372499B1 (en) | 2016-12-27 | 2019-08-06 | Amazon Technologies, Inc. | Efficient region selection system for executing request-driven code |
| US10447648B2 (en) | 2017-06-19 | 2019-10-15 | Amazon Technologies, Inc. | Assignment of a POP to a DNS resolver based on volume of communications over a link between client devices and the POP |
| US10469513B2 (en) | 2016-10-05 | 2019-11-05 | Amazon Technologies, Inc. | Encrypted network addresses |
| US10503613B1 (en) | 2017-04-21 | 2019-12-10 | Amazon Technologies, Inc. | Efficient serving of resources during server unavailability |
| US10592578B1 (en) | 2018-03-07 | 2020-03-17 | Amazon Technologies, Inc. | Predictive content push-enabled content delivery network |
| US10616179B1 (en) | 2015-06-25 | 2020-04-07 | Amazon Technologies, Inc. | Selective routing of domain name system (DNS) requests |
| US10623408B1 (en) | 2012-04-02 | 2020-04-14 | Amazon Technologies, Inc. | Context sensitive object management |
| US10831549B1 (en) | 2016-12-27 | 2020-11-10 | Amazon Technologies, Inc. | Multi-region request-driven code execution system |
| US10862852B1 (en) | 2018-11-16 | 2020-12-08 | Amazon Technologies, Inc. | Resolution of domain name requests in heterogeneous network environments |
| US10938884B1 (en) | 2017-01-30 | 2021-03-02 | Amazon Technologies, Inc. | Origin server cloaking using virtual private cloud network environments |
| US10958501B1 (en) | 2010-09-28 | 2021-03-23 | Amazon Technologies, Inc. | Request routing information based on client IP groupings |
| US11025747B1 (en) | 2018-12-12 | 2021-06-01 | Amazon Technologies, Inc. | Content request pattern-based routing system |
| US11023837B2 (en) | 2012-07-04 | 2021-06-01 | Norsk Hydro Asa | Method for the optimisation of product properties and production costs of industrial processes |
| US11075987B1 (en) | 2017-06-12 | 2021-07-27 | Amazon Technologies, Inc. | Load estimating content delivery network |
| US11290418B2 (en) | 2017-09-25 | 2022-03-29 | Amazon Technologies, Inc. | Hybrid content request routing system |
| US11604667B2 (en) | 2011-04-27 | 2023-03-14 | Amazon Technologies, Inc. | Optimized deployment based upon customer locality |
Families Citing this family (33)
| Publication number | Priority date | Publication date | Assignee | Title |
|---|---|---|---|---|
| US7037172B1 (en) | 1999-04-01 | 2006-05-02 | Beaver Creek Concepts Inc | Advanced wafer planarizing |
| US7572169B1 (en) | 1998-11-06 | 2009-08-11 | Beaver Creek Concepts Inc | Advanced finishing control |
| US6986698B1 (en) | 1999-04-01 | 2006-01-17 | Beaver Creek Concepts Inc | Wafer refining |
| US6739947B1 (en) | 1998-11-06 | 2004-05-25 | Beaver Creek Concepts Inc | In situ friction detector method and apparatus |
| US20130189801A1 (en) * | 1998-11-06 | 2013-07-25 | Semcon Tech, Llc | Advanced finishing control |
| US7008300B1 (en) | 2000-10-10 | 2006-03-07 | Beaver Creek Concepts Inc | Advanced wafer refining |
| US7575501B1 (en) | 1999-04-01 | 2009-08-18 | Beaver Creek Concepts Inc | Advanced workpiece finishing |
| US8353738B2 (en) * | 1998-11-06 | 2013-01-15 | Semcon Tech, Llc | Advanced finishing control |
| US7220164B1 (en) | 2003-12-08 | 2007-05-22 | Beaver Creek Concepts Inc | Advanced finishing control |
| US7878882B2 (en) * | 1999-04-01 | 2011-02-01 | Charles J. Molnar | Advanced workpiece finishing |
| US7131890B1 (en) | 1998-11-06 | 2006-11-07 | Beaver Creek Concepts, Inc. | In situ finishing control |
| US6915177B2 (en) * | 2002-09-30 | 2005-07-05 | Advanced Micro Devices, Inc. | Comprehensive integrated lithographic process control system based on product design and yield feedback system |
| US7016742B2 (en) * | 2002-11-27 | 2006-03-21 | Bahelle Memorial Institute | Decision support for operations and maintenance (DSOM) system |
| DE10336771A1 (en) * | 2003-08-08 | 2005-03-10 | Claas Selbstfahr Erntemasch | Method and device for operating machines |
| DE102004048083A1 (en) * | 2004-09-30 | 2006-04-06 | Claas Selbstfahrende Erntemaschinen Gmbh | Scalable function windows within a display unit |
| US20080168014A1 (en) * | 2006-12-27 | 2008-07-10 | Bhagat Phiroz M | Catalyst discovery through pattern recognition-based modeling and data analysis |
| US7991499B2 (en) * | 2006-12-27 | 2011-08-02 | Molnar Charles J | Advanced finishing control |
| US8357286B1 (en) | 2007-10-29 | 2013-01-22 | Semcon Tech, Llc | Versatile workpiece refining |
| US20110173034A1 (en) * | 2010-01-13 | 2011-07-14 | Lockheed Martin Corporation | Systems, methods and apparatus for supply plan generation and optimization |
| CN102778842B (en) * | 2011-05-13 | 2014-10-01 | 上海联影医疗科技有限公司 | Method for preparing product based on parameter optimization |
| US20120330706A1 (en) * | 2011-06-22 | 2012-12-27 | Accenture Global Services Limited | Workforce planning tool method and system |
| US20150039373A1 (en) * | 2013-08-01 | 2015-02-05 | Motorola Mobility Llc | Method and Apparatus for Material Requirements Planning Adjustments |
| US11209804B2 (en) * | 2014-11-11 | 2021-12-28 | Applied Materials, Inc. | Intelligent processing tools |
| US10281902B2 (en) * | 2016-11-01 | 2019-05-07 | Xometry, Inc. | Methods and apparatus for machine learning predictions of manufacture processes |
| US10930535B2 (en) | 2016-12-02 | 2021-02-23 | Applied Materials, Inc. | RFID part authentication and tracking of processing components |
| US10061300B1 (en) * | 2017-09-29 | 2018-08-28 | Xometry, Inc. | Methods and apparatus for machine learning predictions and multi-objective optimization of manufacturing processes |
| GB2570115B (en) * | 2018-01-10 | 2022-12-21 | Spiro Control Ltd | Process control system and method |
| EP3521947A1 (en) * | 2018-02-06 | 2019-08-07 | Siemens Aktiengesellschaft | Energy management method |
| CN108628165B (en) * | 2018-05-08 | 2019-06-25 | 中国人民解放军战略支援部队航天工程大学 | Rotary inertia time-varying spacecraft is against optimal Adaptive Attitude Tracking control method |
| US11410243B2 (en) * | 2019-01-08 | 2022-08-09 | Clover Health | Segmented actuarial modeling |
| KR102592585B1 (en) * | 2019-02-01 | 2023-10-23 | 한국전자통신연구원 | Method and apparatus for building a translation model |
| US20210012190A1 (en) * | 2019-07-10 | 2021-01-14 | International Business Machines Corporation | Online operating mode trajectory optimization for production processes |
| US11449795B2 (en) | 2019-08-29 | 2022-09-20 | Canvass Analytics Inc. | Process speed-based forecasting |
Citations (15)
| Publication number | Priority date | Publication date | Assignee | Title |
|---|---|---|---|---|
| US4912624A (en) * | 1988-03-30 | 1990-03-27 | Syracuse University | Multi-parameter optimization circuit |
| US4975827A (en) * | 1988-03-17 | 1990-12-04 | Kabushiki Kaisha Toshiba | Optimized process control method and apparatus therefor |
| US5301101A (en) * | 1990-06-21 | 1994-04-05 | Honeywell Inc. | Receding horizon based adaptive control having means for minimizing operating costs |
| US5305221A (en) * | 1990-05-04 | 1994-04-19 | Atherton Robert W | Real world modeling and control process for integrated manufacturing equipment |
| US5521814A (en) * | 1993-04-29 | 1996-05-28 | Betz Laboratories, Inc. | Process optimization and control system that plots inter-relationships between variables to meet an objective |
| US5682309A (en) * | 1995-04-28 | 1997-10-28 | Exxon Chemical Patents Inc. | Feedback method for controlling non-linear processes |
| DE19637917A1 (en) | 1996-09-17 | 1998-03-19 | Siemens Ag | Method and device for designing or controlling the process flow of a plant in the raw materials industry |
| US5740033A (en) | 1992-10-13 | 1998-04-14 | The Dow Chemical Company | Model predictive controller |
| US5781432A (en) * | 1993-03-02 | 1998-07-14 | Pavilion Technologies, Inc. | Method and apparatus for analyzing a neural network within desired operating parameter constraints |
| US6128540A (en) * | 1998-02-20 | 2000-10-03 | Hagen Method Pty. Ltd. | Method and computer system for controlling an industrial process using financial analysis |
| US6207936B1 (en) * | 1996-01-31 | 2001-03-27 | Asm America, Inc. | Model-based predictive control of thermal processing |
| WO2001057605A1 (en) | 2000-02-03 | 2001-08-09 | Pronetix Ltd. | Method for finding optimal set-points for machines and processes |
| US6408220B1 (en) * | 1999-06-01 | 2002-06-18 | Applied Materials, Inc. | Semiconductor processing techniques |
| US6587744B1 (en) * | 1999-06-22 | 2003-07-01 | Brooks Automation, Inc. | Run-to-run controller for use in microelectronic fabrication |
| US6708073B1 (en) * | 2000-08-10 | 2004-03-16 | Advanced Micro Devices, Inc. | Lot specific process design methodology |
-
2002
- 2002-09-13 US US10/243,963 patent/US6810291B2/en not_active Expired - Fee Related
- 2002-09-13 WO PCT/US2002/029101 patent/WO2003025685A1/en not_active Application Discontinuation
Patent Citations (15)
| Publication number | Priority date | Publication date | Assignee | Title |
|---|---|---|---|---|
| US4975827A (en) * | 1988-03-17 | 1990-12-04 | Kabushiki Kaisha Toshiba | Optimized process control method and apparatus therefor |
| US4912624A (en) * | 1988-03-30 | 1990-03-27 | Syracuse University | Multi-parameter optimization circuit |
| US5305221A (en) * | 1990-05-04 | 1994-04-19 | Atherton Robert W | Real world modeling and control process for integrated manufacturing equipment |
| US5301101A (en) * | 1990-06-21 | 1994-04-05 | Honeywell Inc. | Receding horizon based adaptive control having means for minimizing operating costs |
| US5740033A (en) | 1992-10-13 | 1998-04-14 | The Dow Chemical Company | Model predictive controller |
| US5781432A (en) * | 1993-03-02 | 1998-07-14 | Pavilion Technologies, Inc. | Method and apparatus for analyzing a neural network within desired operating parameter constraints |
| US5521814A (en) * | 1993-04-29 | 1996-05-28 | Betz Laboratories, Inc. | Process optimization and control system that plots inter-relationships between variables to meet an objective |
| US5682309A (en) * | 1995-04-28 | 1997-10-28 | Exxon Chemical Patents Inc. | Feedback method for controlling non-linear processes |
| US6207936B1 (en) * | 1996-01-31 | 2001-03-27 | Asm America, Inc. | Model-based predictive control of thermal processing |
| DE19637917A1 (en) | 1996-09-17 | 1998-03-19 | Siemens Ag | Method and device for designing or controlling the process flow of a plant in the raw materials industry |
| US6128540A (en) * | 1998-02-20 | 2000-10-03 | Hagen Method Pty. Ltd. | Method and computer system for controlling an industrial process using financial analysis |
| US6408220B1 (en) * | 1999-06-01 | 2002-06-18 | Applied Materials, Inc. | Semiconductor processing techniques |
| US6587744B1 (en) * | 1999-06-22 | 2003-07-01 | Brooks Automation, Inc. | Run-to-run controller for use in microelectronic fabrication |
| WO2001057605A1 (en) | 2000-02-03 | 2001-08-09 | Pronetix Ltd. | Method for finding optimal set-points for machines and processes |
| US6708073B1 (en) * | 2000-08-10 | 2004-03-16 | Advanced Micro Devices, Inc. | Lot specific process design methodology |
Non-Patent Citations (7)
| Title |
|---|
| "A comparative analysis of run-to-run control algorithms in the seminconductor manufacturing industry"; Ning et al.; Proceedings of Advanced Semiconductor Manufacturing Conference and Workshop; Nov. 12-14, 1996; pp. 375-381.* * |
| "A study in dynamic neural control of semiconductor fabrication processes"; Card, J.P.; IEEE Transactions on Semiconductor Manufacturing; Aug. 2000; vol. 13; Issue 3; pp. 359-365.* * |
| "An adaptive run-to-run optimizing controller for linear and nonlinear semiconductor processes"; Del Castillo et al.; IEEE Transactions on Semiconductor Manufacturing; May 1998, vol. 11; Issue 2; pp. 285-295.* * |
| "Model-based control in microelectronics manufacturing"; Edgar et al.; Proceedings of the 38th Conference on Decision and Control; Dec. 7-10, 1999; vol. 4; pp. 4185-4191.* * |
| Card et al., Dynamic Neural Control for Plasma Etch Process, IEEE Transactions on Neural Networks, 1997. |
| Kim et al., Intelligent Control of Via Formation by Photosensitive BCB for MCM-L/D Applications, IEEE Transactions on Semiconductor Manufacturing, 12:503, 1999. |
| Rietman et al., A System Model for Feedback Control and Analysis of Yield: A Multistep Process Model of Effective Gate Length, Poly Line Width, and IV Parameters, IEEE, 2001. |
Cited By (221)
| Publication number | Priority date | Publication date | Assignee | Title |
|---|---|---|---|---|
| US20040076944A1 (en) * | 2002-08-22 | 2004-04-22 | Ibex Process Technology, Inc. | Supervised learning in the presence of null data |
| US20050130329A1 (en) * | 2003-12-16 | 2005-06-16 | Yushan Liao | Method for the prediction of the source of semiconductor part deviations |
| US7353141B2 (en) | 2004-01-30 | 2008-04-01 | Tokyo Electron Limited | Method and system for monitoring component consumption |
| US20050171730A1 (en) * | 2004-01-30 | 2005-08-04 | Tokyo Electron Limited | Method and system for monitoring component consumption |
| US7233878B2 (en) * | 2004-01-30 | 2007-06-19 | Tokyo Electron Limited | Method and system for monitoring component consumption |
| US20070192059A1 (en) * | 2004-01-30 | 2007-08-16 | Tokyo Electron Limited | Method and system for monitoring component consumption |
| US20060036345A1 (en) * | 2004-08-09 | 2006-02-16 | An Cao | Systems and method for lights-out manufacturing |
| US20060178999A1 (en) * | 2005-02-10 | 2006-08-10 | Rust Langbourne W | Fee determination device |
| US20070038417A1 (en) * | 2005-07-28 | 2007-02-15 | Taiwan Semiconductor Manufacturing Company, Ltd. | Regression system and methods for optical proximity correction modeling |
| US7778805B2 (en) * | 2005-07-28 | 2010-08-17 | Taiwan Semiconductor Manufacturing Company, Ltd. | Regression system and methods for optical proximity correction modeling |
| US20100312871A1 (en) * | 2006-03-31 | 2010-12-09 | Amazon Technologies, Inc. | Executing Programs Based on User-Specified Constraints |
| US9253211B2 (en) | 2006-03-31 | 2016-02-02 | Amazon Technologies, Inc. | Managing communications between computing nodes |
| US20080059557A1 (en) * | 2006-03-31 | 2008-03-06 | Desantis Peter N | Executing programs based on user-specified constraints |
| US7792944B2 (en) * | 2006-03-31 | 2010-09-07 | Amazon Technologies, Inc. | Executing programs based on user-specified constraints |
| US11539753B2 (en) | 2006-03-31 | 2022-12-27 | Amazon Technologies, Inc. | Network-accessible service for executing virtual machines using client-provided virtual machine images |
| US8010651B2 (en) * | 2006-03-31 | 2011-08-30 | Amazon Technologies, Inc. | Executing programs based on user-specified constraints |
| US8190682B2 (en) | 2006-03-31 | 2012-05-29 | Amazon Technologies, Inc. | Managing execution of programs by multiple computing systems |
| US10791149B2 (en) | 2006-03-31 | 2020-09-29 | Amazon Technologies, Inc. | Network-accessible service for executing virtual machines using client-provided virtual machine images |
| US20070240160A1 (en) * | 2006-03-31 | 2007-10-11 | Amazon Technologies, Inc. | Managing execution of programs by multiple computing systems |
| US10348770B2 (en) | 2006-03-31 | 2019-07-09 | Amazon Technologies, Inc. | Managing execution of programs by multiple computing systems |
| US9621593B2 (en) | 2006-03-31 | 2017-04-11 | Amazon Technologies, Inc. | Managing execution of programs by multiple computing systems |
| US20100100216A1 (en) * | 2007-04-19 | 2010-04-22 | Ames Ii Daniel E | Multiple product, multiple step optimization methods |
| AU2008241544B2 (en) * | 2007-04-19 | 2013-10-31 | Société des Produits Nestlé S.A. | Multiple product, multiple step optimization methods |
| US8412369B2 (en) * | 2007-04-19 | 2013-04-02 | Nestec S.A. | Multiple product, multiple step optimization methods |
| US10027582B2 (en) | 2007-06-29 | 2018-07-17 | Amazon Technologies, Inc. | Updating routing information based on client location |
| US9992303B2 (en) | 2007-06-29 | 2018-06-05 | Amazon Technologies, Inc. | Request routing utilizing client location information |
| US9021127B2 (en) | 2007-06-29 | 2015-04-28 | Amazon Technologies, Inc. | Updating routing information based on client location |
| US9021129B2 (en) | 2007-06-29 | 2015-04-28 | Amazon Technologies, Inc. | Request routing utilizing client location information |
| US9407699B2 (en) | 2008-03-31 | 2016-08-02 | Amazon Technologies, Inc. | Content management |
| US9544394B2 (en) | 2008-03-31 | 2017-01-10 | Amazon Technologies, Inc. | Network resource identification |
| US8601090B1 (en) | 2008-03-31 | 2013-12-03 | Amazon Technologies, Inc. | Network resource identification |
| US8639817B2 (en) | 2008-03-31 | 2014-01-28 | Amazon Technologies, Inc. | Content management |
| US11451472B2 (en) | 2008-03-31 | 2022-09-20 | Amazon Technologies, Inc. | Request routing based on class |
| US9888089B2 (en) | 2008-03-31 | 2018-02-06 | Amazon Technologies, Inc. | Client side cache management |
| US8713156B2 (en) | 2008-03-31 | 2014-04-29 | Amazon Technologies, Inc. | Request routing based on class |
| US11909639B2 (en) | 2008-03-31 | 2024-02-20 | Amazon Technologies, Inc. | Request routing based on class |
| US9894168B2 (en) | 2008-03-31 | 2018-02-13 | Amazon Technologies, Inc. | Locality based content distribution |
| US8756325B2 (en) | 2008-03-31 | 2014-06-17 | Amazon Technologies, Inc. | Content management |
| US9954934B2 (en) | 2008-03-31 | 2018-04-24 | Amazon Technologies, Inc. | Content delivery reconciliation |
| US10157135B2 (en) | 2008-03-31 | 2018-12-18 | Amazon Technologies, Inc. | Cache optimization |
| US9621660B2 (en) | 2008-03-31 | 2017-04-11 | Amazon Technologies, Inc. | Locality based content distribution |
| US11245770B2 (en) | 2008-03-31 | 2022-02-08 | Amazon Technologies, Inc. | Locality based content distribution |
| US8930544B2 (en) | 2008-03-31 | 2015-01-06 | Amazon Technologies, Inc. | Network resource identification |
| US11194719B2 (en) | 2008-03-31 | 2021-12-07 | Amazon Technologies, Inc. | Cache optimization |
| US9571389B2 (en) | 2008-03-31 | 2017-02-14 | Amazon Technologies, Inc. | Request routing based on class |
| US8606996B2 (en) | 2008-03-31 | 2013-12-10 | Amazon Technologies, Inc. | Cache optimization |
| US10797995B2 (en) | 2008-03-31 | 2020-10-06 | Amazon Technologies, Inc. | Request routing based on class |
| US10158729B2 (en) | 2008-03-31 | 2018-12-18 | Amazon Technologies, Inc. | Locality based content distribution |
| US9009286B2 (en) | 2008-03-31 | 2015-04-14 | Amazon Technologies, Inc. | Locality based content distribution |
| US9479476B2 (en) | 2008-03-31 | 2016-10-25 | Amazon Technologies, Inc. | Processing of DNS queries |
| US9887915B2 (en) | 2008-03-31 | 2018-02-06 | Amazon Technologies, Inc. | Request routing based on class |
| US10305797B2 (en) | 2008-03-31 | 2019-05-28 | Amazon Technologies, Inc. | Request routing based on class |
| US9026616B2 (en) | 2008-03-31 | 2015-05-05 | Amazon Technologies, Inc. | Content delivery reconciliation |
| US9332078B2 (en) | 2008-03-31 | 2016-05-03 | Amazon Technologies, Inc. | Locality based content distribution |
| US10511567B2 (en) | 2008-03-31 | 2019-12-17 | Amazon Technologies, Inc. | Network resource identification |
| US8533293B1 (en) | 2008-03-31 | 2013-09-10 | Amazon Technologies, Inc. | Client side cache management |
| US10530874B2 (en) | 2008-03-31 | 2020-01-07 | Amazon Technologies, Inc. | Locality based content distribution |
| US10771552B2 (en) | 2008-03-31 | 2020-09-08 | Amazon Technologies, Inc. | Content management |
| US9210235B2 (en) | 2008-03-31 | 2015-12-08 | Amazon Technologies, Inc. | Client side cache management |
| US10645149B2 (en) | 2008-03-31 | 2020-05-05 | Amazon Technologies, Inc. | Content delivery reconciliation |
| US9208097B2 (en) | 2008-03-31 | 2015-12-08 | Amazon Technologies, Inc. | Cache optimization |
| US10554748B2 (en) | 2008-03-31 | 2020-02-04 | Amazon Technologies, Inc. | Content management |
| US9608957B2 (en) | 2008-06-30 | 2017-03-28 | Amazon Technologies, Inc. | Request routing using network computing components |
| US9912740B2 (en) | 2008-06-30 | 2018-03-06 | Amazon Technologies, Inc. | Latency measurement in resource requests |
| US9021128B2 (en) | 2008-06-30 | 2015-04-28 | Amazon Technologies, Inc. | Request routing using network computing components |
| US8732309B1 (en) | 2008-11-17 | 2014-05-20 | Amazon Technologies, Inc. | Request routing utilizing cost information |
| US11283715B2 (en) | 2008-11-17 | 2022-03-22 | Amazon Technologies, Inc. | Updating routing information based on client location |
| US8510448B2 (en) | 2008-11-17 | 2013-08-13 | Amazon Technologies, Inc. | Service provider registration by a content broker |
| US9734472B2 (en) | 2008-11-17 | 2017-08-15 | Amazon Technologies, Inc. | Request routing utilizing cost information |
| US9251112B2 (en) | 2008-11-17 | 2016-02-02 | Amazon Technologies, Inc. | Managing content delivery network service providers |
| US10523783B2 (en) | 2008-11-17 | 2019-12-31 | Amazon Technologies, Inc. | Request routing utilizing client location information |
| US10116584B2 (en) | 2008-11-17 | 2018-10-30 | Amazon Technologies, Inc. | Managing content delivery network service providers |
| US9515949B2 (en) | 2008-11-17 | 2016-12-06 | Amazon Technologies, Inc. | Managing content delivery network service providers |
| US8788671B2 (en) | 2008-11-17 | 2014-07-22 | Amazon Technologies, Inc. | Managing content delivery network service providers by a content broker |
| US8495220B2 (en) | 2008-11-17 | 2013-07-23 | Amazon Technologies, Inc. | Managing CDN registration by a storage provider |
| US9985927B2 (en) | 2008-11-17 | 2018-05-29 | Amazon Technologies, Inc. | Managing content delivery network service providers by a content broker |
| US9590946B2 (en) | 2008-11-17 | 2017-03-07 | Amazon Technologies, Inc. | Managing content delivery network service providers |
| US11115500B2 (en) | 2008-11-17 | 2021-09-07 | Amazon Technologies, Inc. | Request routing utilizing client location information |
| US11811657B2 (en) | 2008-11-17 | 2023-11-07 | Amazon Technologies, Inc. | Updating routing information based on client location |
| US9444759B2 (en) | 2008-11-17 | 2016-09-13 | Amazon Technologies, Inc. | Service provider registration by a content broker |
| US9451046B2 (en) | 2008-11-17 | 2016-09-20 | Amazon Technologies, Inc. | Managing CDN registration by a storage provider |
| US8583776B2 (en) | 2008-11-17 | 2013-11-12 | Amazon Technologies, Inc. | Managing content delivery network service providers |
| US9787599B2 (en) | 2008-11-17 | 2017-10-10 | Amazon Technologies, Inc. | Managing content delivery network service providers |
| US10742550B2 (en) | 2008-11-17 | 2020-08-11 | Amazon Technologies, Inc. | Updating routing information based on client location |
| US8688837B1 (en) | 2009-03-27 | 2014-04-01 | Amazon Technologies, Inc. | Dynamically translating resource identifiers for request routing using popularity information |
| US9237114B2 (en) | 2009-03-27 | 2016-01-12 | Amazon Technologies, Inc. | Managing resources in resource cache components |
| US8996664B2 (en) | 2009-03-27 | 2015-03-31 | Amazon Technologies, Inc. | Translation of resource identifiers using popularity information upon client request |
| US9191458B2 (en) | 2009-03-27 | 2015-11-17 | Amazon Technologies, Inc. | Request routing using a popularity identifier at a DNS nameserver |
| US8521851B1 (en) | 2009-03-27 | 2013-08-27 | Amazon Technologies, Inc. | DNS query processing using resource identifiers specifying an application broker |
| US9083675B2 (en) | 2009-03-27 | 2015-07-14 | Amazon Technologies, Inc. | Translation of resource identifiers using popularity information upon client request |
| US10491534B2 (en) | 2009-03-27 | 2019-11-26 | Amazon Technologies, Inc. | Managing resources and entries in tracking information in resource cache components |
| US8521885B1 (en) | 2009-03-27 | 2013-08-27 | Amazon Technologies, Inc. | Dynamically translating resource identifiers for request routing using popularity information |
| US10574787B2 (en) | 2009-03-27 | 2020-02-25 | Amazon Technologies, Inc. | Translation of resource identifiers using popularity information upon client request |
| US10601767B2 (en) | 2009-03-27 | 2020-03-24 | Amazon Technologies, Inc. | DNS query processing based on application information |
| US10230819B2 (en) | 2009-03-27 | 2019-03-12 | Amazon Technologies, Inc. | Translation of resource identifiers using popularity information upon client request |
| US8756341B1 (en) | 2009-03-27 | 2014-06-17 | Amazon Technologies, Inc. | Request routing utilizing popularity information |
| US10264062B2 (en) | 2009-03-27 | 2019-04-16 | Amazon Technologies, Inc. | Request routing using a popularity identifier to identify a cache component |
| US9176894B2 (en) | 2009-06-16 | 2015-11-03 | Amazon Technologies, Inc. | Managing resources using resource expiration data |
| US10783077B2 (en) | 2009-06-16 | 2020-09-22 | Amazon Technologies, Inc. | Managing resources using resource expiration data |
| US10521348B2 (en) | 2009-06-16 | 2019-12-31 | Amazon Technologies, Inc. | Managing resources using resource expiration data |
| US8543702B1 (en) | 2009-06-16 | 2013-09-24 | Amazon Technologies, Inc. | Managing resources using resource expiration data |
| US8782236B1 (en) | 2009-06-16 | 2014-07-15 | Amazon Technologies, Inc. | Managing resources using resource expiration data |
| US10785037B2 (en) | 2009-09-04 | 2020-09-22 | Amazon Technologies, Inc. | Managing secure content in a content delivery network |
| US9712325B2 (en) | 2009-09-04 | 2017-07-18 | Amazon Technologies, Inc. | Managing secure content in a content delivery network |
| US10135620B2 (en) | 2009-09-04 | 2018-11-20 | Amazon Technologis, Inc. | Managing secure content in a content delivery network |
| US9130756B2 (en) | 2009-09-04 | 2015-09-08 | Amazon Technologies, Inc. | Managing secure content in a content delivery network |
| US9893957B2 (en) | 2009-10-02 | 2018-02-13 | Amazon Technologies, Inc. | Forward-based resource delivery network management techniques |
| US10218584B2 (en) | 2009-10-02 | 2019-02-26 | Amazon Technologies, Inc. | Forward-based resource delivery network management techniques |
| US9246776B2 (en) | 2009-10-02 | 2016-01-26 | Amazon Technologies, Inc. | Forward-based resource delivery network management techniques |
| US11205037B2 (en) | 2010-01-28 | 2021-12-21 | Amazon Technologies, Inc. | Content distribution network |
| US9495338B1 (en) | 2010-01-28 | 2016-11-15 | Amazon Technologies, Inc. | Content distribution network |
| US10506029B2 (en) | 2010-01-28 | 2019-12-10 | Amazon Technologies, Inc. | Content distribution network |
| US9288153B2 (en) | 2010-08-26 | 2016-03-15 | Amazon Technologies, Inc. | Processing encoded content |
| US10931738B2 (en) | 2010-09-28 | 2021-02-23 | Amazon Technologies, Inc. | Point of presence management in request routing |
| US10778554B2 (en) | 2010-09-28 | 2020-09-15 | Amazon Technologies, Inc. | Latency measurement in resource requests |
| US9794216B2 (en) | 2010-09-28 | 2017-10-17 | Amazon Technologies, Inc. | Request routing in a networked environment |
| US9787775B1 (en) | 2010-09-28 | 2017-10-10 | Amazon Technologies, Inc. | Point of presence management in request routing |
| US8819283B2 (en) | 2010-09-28 | 2014-08-26 | Amazon Technologies, Inc. | Request routing in a networked environment |
| US8930513B1 (en) | 2010-09-28 | 2015-01-06 | Amazon Technologies, Inc. | Latency measurement in resource requests |
| US10015237B2 (en) | 2010-09-28 | 2018-07-03 | Amazon Technologies, Inc. | Point of presence management in request routing |
| US8938526B1 (en) | 2010-09-28 | 2015-01-20 | Amazon Technologies, Inc. | Request routing management based on network components |
| US11108729B2 (en) | 2010-09-28 | 2021-08-31 | Amazon Technologies, Inc. | Managing request routing information utilizing client identifiers |
| US10958501B1 (en) | 2010-09-28 | 2021-03-23 | Amazon Technologies, Inc. | Request routing information based on client IP groupings |
| US10225322B2 (en) | 2010-09-28 | 2019-03-05 | Amazon Technologies, Inc. | Point of presence management in request routing |
| US9003035B1 (en) | 2010-09-28 | 2015-04-07 | Amazon Technologies, Inc. | Point of presence management in request routing |
| US9106701B2 (en) | 2010-09-28 | 2015-08-11 | Amazon Technologies, Inc. | Request routing management based on network components |
| US8924528B1 (en) | 2010-09-28 | 2014-12-30 | Amazon Technologies, Inc. | Latency measurement in resource requests |
| US10079742B1 (en) | 2010-09-28 | 2018-09-18 | Amazon Technologies, Inc. | Latency measurement in resource requests |
| US9160703B2 (en) | 2010-09-28 | 2015-10-13 | Amazon Technologies, Inc. | Request routing management based on network components |
| US10097398B1 (en) | 2010-09-28 | 2018-10-09 | Amazon Technologies, Inc. | Point of presence management in request routing |
| US9185012B2 (en) | 2010-09-28 | 2015-11-10 | Amazon Technologies, Inc. | Latency measurement in resource requests |
| US9191338B2 (en) | 2010-09-28 | 2015-11-17 | Amazon Technologies, Inc. | Request routing in a networked environment |
| US11336712B2 (en) | 2010-09-28 | 2022-05-17 | Amazon Technologies, Inc. | Point of presence management in request routing |
| US9712484B1 (en) | 2010-09-28 | 2017-07-18 | Amazon Technologies, Inc. | Managing request routing information utilizing client identifiers |
| US9253065B2 (en) | 2010-09-28 | 2016-02-02 | Amazon Technologies, Inc. | Latency measurement in resource requests |
| US9800539B2 (en) | 2010-09-28 | 2017-10-24 | Amazon Technologies, Inc. | Request routing management based on network components |
| US8676918B2 (en) | 2010-09-28 | 2014-03-18 | Amazon Technologies, Inc. | Point of presence management in request routing |
| US9407681B1 (en) | 2010-09-28 | 2016-08-02 | Amazon Technologies, Inc. | Latency measurement in resource requests |
| US9497259B1 (en) | 2010-09-28 | 2016-11-15 | Amazon Technologies, Inc. | Point of presence management in request routing |
| US11632420B2 (en) | 2010-09-28 | 2023-04-18 | Amazon Technologies, Inc. | Point of presence management in request routing |
| US8577992B1 (en) | 2010-09-28 | 2013-11-05 | Amazon Technologies, Inc. | Request routing management based on network components |
| US10951725B2 (en) | 2010-11-22 | 2021-03-16 | Amazon Technologies, Inc. | Request routing processing |
| US9003040B2 (en) | 2010-11-22 | 2015-04-07 | Amazon Technologies, Inc. | Request routing processing |
| US9930131B2 (en) | 2010-11-22 | 2018-03-27 | Amazon Technologies, Inc. | Request routing processing |
| US9391949B1 (en) | 2010-12-03 | 2016-07-12 | Amazon Technologies, Inc. | Request routing processing |
| US8626950B1 (en) | 2010-12-03 | 2014-01-07 | Amazon Technologies, Inc. | Request routing processing |
| US11604667B2 (en) | 2011-04-27 | 2023-03-14 | Amazon Technologies, Inc. | Optimized deployment based upon customer locality |
| US9678103B2 (en) * | 2011-10-28 | 2017-06-13 | Keysight Technologies, Inc. | Automatic tuning of atomic force microscope |
| US20130110262A1 (en) * | 2011-10-28 | 2013-05-02 | Agilent Technologies, Inc. | Automatic tuning of atomic force microscope |
| US9628554B2 (en) | 2012-02-10 | 2017-04-18 | Amazon Technologies, Inc. | Dynamic content delivery |
| US10021179B1 (en) | 2012-02-21 | 2018-07-10 | Amazon Technologies, Inc. | Local resource delivery network |
| US9083743B1 (en) | 2012-03-21 | 2015-07-14 | Amazon Technologies, Inc. | Managing request routing information utilizing performance information |
| US9172674B1 (en) | 2012-03-21 | 2015-10-27 | Amazon Technologies, Inc. | Managing request routing information utilizing performance information |
| US10623408B1 (en) | 2012-04-02 | 2020-04-14 | Amazon Technologies, Inc. | Context sensitive object management |
| US11303717B2 (en) | 2012-06-11 | 2022-04-12 | Amazon Technologies, Inc. | Processing DNS queries to identify pre-processing information |
| US11729294B2 (en) | 2012-06-11 | 2023-08-15 | Amazon Technologies, Inc. | Processing DNS queries to identify pre-processing information |
| US10225362B2 (en) | 2012-06-11 | 2019-03-05 | Amazon Technologies, Inc. | Processing DNS queries to identify pre-processing information |
| US9154551B1 (en) | 2012-06-11 | 2015-10-06 | Amazon Technologies, Inc. | Processing DNS queries to identify pre-processing information |
| US11023837B2 (en) | 2012-07-04 | 2021-06-01 | Norsk Hydro Asa | Method for the optimisation of product properties and production costs of industrial processes |
| US9525659B1 (en) | 2012-09-04 | 2016-12-20 | Amazon Technologies, Inc. | Request routing utilizing point of presence load information |
| US10542079B2 (en) | 2012-09-20 | 2020-01-21 | Amazon Technologies, Inc. | Automated profiling of resource usage |
| US9135048B2 (en) | 2012-09-20 | 2015-09-15 | Amazon Technologies, Inc. | Automated profiling of resource usage |
| US10015241B2 (en) | 2012-09-20 | 2018-07-03 | Amazon Technologies, Inc. | Automated profiling of resource usage |
| US9323577B2 (en) | 2012-09-20 | 2016-04-26 | Amazon Technologies, Inc. | Automated profiling of resource usage |
| US10205698B1 (en) | 2012-12-19 | 2019-02-12 | Amazon Technologies, Inc. | Source-dependent address resolution |
| US10645056B2 (en) | 2012-12-19 | 2020-05-05 | Amazon Technologies, Inc. | Source-dependent address resolution |
| US9294391B1 (en) | 2013-06-04 | 2016-03-22 | Amazon Technologies, Inc. | Managing network computing components utilizing request routing |
| US10374955B2 (en) | 2013-06-04 | 2019-08-06 | Amazon Technologies, Inc. | Managing network computing components utilizing request routing |
| US9929959B2 (en) | 2013-06-04 | 2018-03-27 | Amazon Technologies, Inc. | Managing network computing components utilizing request routing |
| US10033627B1 (en) | 2014-12-18 | 2018-07-24 | Amazon Technologies, Inc. | Routing mode and point-of-presence selection service |
| US10097448B1 (en) | 2014-12-18 | 2018-10-09 | Amazon Technologies, Inc. | Routing mode and point-of-presence selection service |
| US10091096B1 (en) | 2014-12-18 | 2018-10-02 | Amazon Technologies, Inc. | Routing mode and point-of-presence selection service |
| US11863417B2 (en) | 2014-12-18 | 2024-01-02 | Amazon Technologies, Inc. | Routing mode and point-of-presence selection service |
| US10728133B2 (en) | 2014-12-18 | 2020-07-28 | Amazon Technologies, Inc. | Routing mode and point-of-presence selection service |
| US11381487B2 (en) | 2014-12-18 | 2022-07-05 | Amazon Technologies, Inc. | Routing mode and point-of-presence selection service |
| US11297140B2 (en) | 2015-03-23 | 2022-04-05 | Amazon Technologies, Inc. | Point of presence based data uploading |
| US10225326B1 (en) | 2015-03-23 | 2019-03-05 | Amazon Technologies, Inc. | Point of presence based data uploading |
| US9887932B1 (en) | 2015-03-30 | 2018-02-06 | Amazon Technologies, Inc. | Traffic surge management for points of presence |
| US9887931B1 (en) | 2015-03-30 | 2018-02-06 | Amazon Technologies, Inc. | Traffic surge management for points of presence |
| US9819567B1 (en) | 2015-03-30 | 2017-11-14 | Amazon Technologies, Inc. | Traffic surge management for points of presence |
| US10469355B2 (en) | 2015-03-30 | 2019-11-05 | Amazon Technologies, Inc. | Traffic surge management for points of presence |
| US11461402B2 (en) | 2015-05-13 | 2022-10-04 | Amazon Technologies, Inc. | Routing based request correlation |
| US10691752B2 (en) | 2015-05-13 | 2020-06-23 | Amazon Technologies, Inc. | Routing based request correlation |
| US10180993B2 (en) | 2015-05-13 | 2019-01-15 | Amazon Technologies, Inc. | Routing based request correlation |
| US9832141B1 (en) | 2015-05-13 | 2017-11-28 | Amazon Technologies, Inc. | Routing based request correlation |
| US10616179B1 (en) | 2015-06-25 | 2020-04-07 | Amazon Technologies, Inc. | Selective routing of domain name system (DNS) requests |
| US10097566B1 (en) | 2015-07-31 | 2018-10-09 | Amazon Technologies, Inc. | Identifying targets of network attacks |
| US9774619B1 (en) | 2015-09-24 | 2017-09-26 | Amazon Technologies, Inc. | Mitigating network attacks |
| US10200402B2 (en) | 2015-09-24 | 2019-02-05 | Amazon Technologies, Inc. | Mitigating network attacks |
| US9742795B1 (en) | 2015-09-24 | 2017-08-22 | Amazon Technologies, Inc. | Mitigating network attacks |
| US9794281B1 (en) | 2015-09-24 | 2017-10-17 | Amazon Technologies, Inc. | Identifying sources of network attacks |
| US11134134B2 (en) | 2015-11-10 | 2021-09-28 | Amazon Technologies, Inc. | Routing for origin-facing points of presence |
| US10270878B1 (en) | 2015-11-10 | 2019-04-23 | Amazon Technologies, Inc. | Routing for origin-facing points of presence |
| US10257307B1 (en) | 2015-12-11 | 2019-04-09 | Amazon Technologies, Inc. | Reserved cache space in content delivery networks |
| US10049051B1 (en) | 2015-12-11 | 2018-08-14 | Amazon Technologies, Inc. | Reserved cache space in content delivery networks |
| US10348639B2 (en) | 2015-12-18 | 2019-07-09 | Amazon Technologies, Inc. | Use of virtual endpoints to improve data transmission rates |
| US11463550B2 (en) | 2016-06-06 | 2022-10-04 | Amazon Technologies, Inc. | Request management for hierarchical cache |
| US10075551B1 (en) | 2016-06-06 | 2018-09-11 | Amazon Technologies, Inc. | Request management for hierarchical cache |
| US10666756B2 (en) | 2016-06-06 | 2020-05-26 | Amazon Technologies, Inc. | Request management for hierarchical cache |
| US11457088B2 (en) | 2016-06-29 | 2022-09-27 | Amazon Technologies, Inc. | Adaptive transfer rate for retrieving content from a server |
| US10110694B1 (en) | 2016-06-29 | 2018-10-23 | Amazon Technologies, Inc. | Adaptive transfer rate for retrieving content from a server |
| US9992086B1 (en) | 2016-08-23 | 2018-06-05 | Amazon Technologies, Inc. | External health checking of virtual private cloud network environments |
| US10516590B2 (en) | 2016-08-23 | 2019-12-24 | Amazon Technologies, Inc. | External health checking of virtual private cloud network environments |
| US10033691B1 (en) | 2016-08-24 | 2018-07-24 | Amazon Technologies, Inc. | Adaptive resolution of domain name requests in virtual private cloud network environments |
| US10469442B2 (en) | 2016-08-24 | 2019-11-05 | Amazon Technologies, Inc. | Adaptive resolution of domain name requests in virtual private cloud network environments |
| US10505961B2 (en) | 2016-10-05 | 2019-12-10 | Amazon Technologies, Inc. | Digitally signed network address |
| US10616250B2 (en) | 2016-10-05 | 2020-04-07 | Amazon Technologies, Inc. | Network addresses with encoded DNS-level information |
| US10469513B2 (en) | 2016-10-05 | 2019-11-05 | Amazon Technologies, Inc. | Encrypted network addresses |
| US11330008B2 (en) | 2016-10-05 | 2022-05-10 | Amazon Technologies, Inc. | Network addresses with encoded DNS-level information |
| US10372499B1 (en) | 2016-12-27 | 2019-08-06 | Amazon Technologies, Inc. | Efficient region selection system for executing request-driven code |
| US10831549B1 (en) | 2016-12-27 | 2020-11-10 | Amazon Technologies, Inc. | Multi-region request-driven code execution system |
| US11762703B2 (en) | 2016-12-27 | 2023-09-19 | Amazon Technologies, Inc. | Multi-region request-driven code execution system |
| US10938884B1 (en) | 2017-01-30 | 2021-03-02 | Amazon Technologies, Inc. | Origin server cloaking using virtual private cloud network environments |
| US10503613B1 (en) | 2017-04-21 | 2019-12-10 | Amazon Technologies, Inc. | Efficient serving of resources during server unavailability |
| US11075987B1 (en) | 2017-06-12 | 2021-07-27 | Amazon Technologies, Inc. | Load estimating content delivery network |
| US10447648B2 (en) | 2017-06-19 | 2019-10-15 | Amazon Technologies, Inc. | Assignment of a POP to a DNS resolver based on volume of communications over a link between client devices and the POP |
| US11290418B2 (en) | 2017-09-25 | 2022-03-29 | Amazon Technologies, Inc. | Hybrid content request routing system |
| US10592578B1 (en) | 2018-03-07 | 2020-03-17 | Amazon Technologies, Inc. | Predictive content push-enabled content delivery network |
| US11362986B2 (en) | 2018-11-16 | 2022-06-14 | Amazon Technologies, Inc. | Resolution of domain name requests in heterogeneous network environments |
| US10862852B1 (en) | 2018-11-16 | 2020-12-08 | Amazon Technologies, Inc. | Resolution of domain name requests in heterogeneous network environments |
| US11025747B1 (en) | 2018-12-12 | 2021-06-01 | Amazon Technologies, Inc. | Content request pattern-based routing system |
Also Published As
| Publication number | Publication date |
|---|---|
| WO2003025685A1 (en) | 2003-03-27 |
| US20030083757A1 (en) | 2003-05-01 |
Similar Documents
| Publication | Publication Date | Title |
|---|---|---|
| US6810291B2 (en) | Scalable, hierarchical control for complex processes | |
| US20060036345A1 (en) | Systems and method for lights-out manufacturing | |
| US6904328B2 (en) | Large scale process control by driving factor identification | |
| US6970857B2 (en) | Intelligent control for process optimization and parts maintenance | |
| KR100994271B1 (en) | Comprehensive integrated lithographic process control system based on product design and yield feedback system | |
| US6700648B2 (en) | Method for controlling a processing apparatus | |
| Chien et al. | Manufacturing intelligence to forecast and reduce semiconductor cycle time | |
| US5467883A (en) | Active neural network control of wafer attributes in a plasma etch process | |
| KR101003558B1 (en) | Probability constrained optimization for electrical fabrication control | |
| US5737496A (en) | Active neural network control of wafer attributes in a plasma etch process | |
| JPH09129530A (en) | Process module control using site model and monitor wafer control | |
| US6718224B2 (en) | System and method for estimating error in a manufacturing process | |
| Chien et al. | A novel approach to hedge and compensate the critical dimension variation of the developed-and-etched circuit patterns for yield enhancement in semiconductor manufacturing | |
| Han et al. | Using neural network process models to perform PECVD silicon dioxide recipe synthesis via genetic algorithms | |
| CN102301448B (en) | Method and system for estimating context offsets for run-to-run control in a semiconductor fabrication facility | |
| Zhong et al. | Adaptive cautious regularized run-to-run controller for lithography process | |
| CN116053164A (en) | Method and system for controlling critical dimension | |
| EP0602855A1 (en) | Active neural network control of wafer attributes in a plasma etch process | |
| Geisler et al. | Neurofuzzy modeling of chemical vapor deposition processes | |
| Card et al. | Dynamic neural control for a plasma etch process | |
| Rietman et al. | A production demonstration of wafer-to-wafer plasma gate etch control by adaptive real-time computation of the over-etch time from in situ process signals | |
| US20040019470A1 (en) | Control of complex manufacturing processes using continuous process data | |
| Grosman et al. | Yield enhancement in photolithography through model-based process control: average mode control | |
| Kim et al. | Intelligent control of via formation by photosensitive BCB for MCM-L/D applications | |
| US20040076944A1 (en) | Supervised learning in the presence of null data |
Legal Events
| Date | Code | Title | Description |
|---|---|---|---|
| AS | Assignment |
Owner name: IBEX PROCESS TECHNOLOGY, INC., MASSACHUSETTS Free format text: ASSIGNMENT OF ASSIGNORS INTEREST;ASSIGNORS:CARD, JILL P.;RIETMAN, EDWARD A.;REEL/FRAME:013611/0732 Effective date: 20021206 |
|
| REMI | Maintenance fee reminder mailed | ||
| LAPS | Lapse for failure to pay maintenance fees | ||
| STCH | Information on status: patent discontinuation |
Free format text: PATENT EXPIRED DUE TO NONPAYMENT OF MAINTENANCE FEES UNDER 37 CFR 1.362 |
|
| FP | Lapsed due to failure to pay maintenance fee |
Effective date: 20081026 |