US9817918B2 - Sub-tree similarity for component substitution - Google Patents
Sub-tree similarity for component substitution Download PDFInfo
- Publication number
- US9817918B2 US9817918B2 US13/007,175 US201113007175A US9817918B2 US 9817918 B2 US9817918 B2 US 9817918B2 US 201113007175 A US201113007175 A US 201113007175A US 9817918 B2 US9817918 B2 US 9817918B2
- Authority
- US
- United States
- Prior art keywords
- trees
- sub
- tree
- similarity
- nodes
- Prior art date
- Legal status (The legal status is an assumption and is not a legal conclusion. Google has not performed a legal analysis and makes no representation as to the accuracy of the status listed.)
- Active, expires
Links
Images


Classifications
-
- G06F17/30961—
-
- G—PHYSICS
- G06—COMPUTING; CALCULATING OR COUNTING
- G06F—ELECTRIC DIGITAL DATA PROCESSING
- G06F16/00—Information retrieval; Database structures therefor; File system structures therefor
- G06F16/90—Details of database functions independent of the retrieved data types
- G06F16/901—Indexing; Data structures therefor; Storage structures
- G06F16/9027—Trees
-
- G—PHYSICS
- G06—COMPUTING; CALCULATING OR COUNTING
- G06Q—INFORMATION AND COMMUNICATION TECHNOLOGY [ICT] SPECIALLY ADAPTED FOR ADMINISTRATIVE, COMMERCIAL, FINANCIAL, MANAGERIAL OR SUPERVISORY PURPOSES; SYSTEMS OR METHODS SPECIALLY ADAPTED FOR ADMINISTRATIVE, COMMERCIAL, FINANCIAL, MANAGERIAL OR SUPERVISORY PURPOSES, NOT OTHERWISE PROVIDED FOR
- G06Q10/00—Administration; Management
- G06Q10/06—Resources, workflows, human or project management; Enterprise or organisation planning; Enterprise or organisation modelling
-
- G—PHYSICS
- G06—COMPUTING; CALCULATING OR COUNTING
- G06Q—INFORMATION AND COMMUNICATION TECHNOLOGY [ICT] SPECIALLY ADAPTED FOR ADMINISTRATIVE, COMMERCIAL, FINANCIAL, MANAGERIAL OR SUPERVISORY PURPOSES; SYSTEMS OR METHODS SPECIALLY ADAPTED FOR ADMINISTRATIVE, COMMERCIAL, FINANCIAL, MANAGERIAL OR SUPERVISORY PURPOSES, NOT OTHERWISE PROVIDED FOR
- G06Q30/00—Commerce
- G06Q30/06—Buying, selling or leasing transactions
-
- Y—GENERAL TAGGING OF NEW TECHNOLOGICAL DEVELOPMENTS; GENERAL TAGGING OF CROSS-SECTIONAL TECHNOLOGIES SPANNING OVER SEVERAL SECTIONS OF THE IPC; TECHNICAL SUBJECTS COVERED BY FORMER USPC CROSS-REFERENCE ART COLLECTIONS [XRACs] AND DIGESTS
- Y02—TECHNOLOGIES OR APPLICATIONS FOR MITIGATION OR ADAPTATION AGAINST CLIMATE CHANGE
- Y02P—CLIMATE CHANGE MITIGATION TECHNOLOGIES IN THE PRODUCTION OR PROCESSING OF GOODS
- Y02P90/00—Enabling technologies with a potential contribution to greenhouse gas [GHG] emissions mitigation
- Y02P90/80—Management or planning
- Y02P90/84—Greenhouse gas [GHG] management systems
Definitions
- a packaging manufacturer may maintain a database including price to obtain the stock materials (e.g., cardboard, plastic, and ink), produce the packaging (e.g., including cutting the cardboard, extruding the plastic, and printing the labels), and delivering the packaging to their customers.
- stock materials e.g., cardboard, plastic, and ink
- the packaging e.g., including cutting the cardboard, extruding the plastic, and printing the labels
- the manufacturer is able to use their database to quickly determine the overall impact the component change in price has on the overall price of their product so that the manufacturer can raise the price of their product (or make other adjustments) in a timely manner to reduce or eliminate any impact on their profit.
- Electronics devices e.g., computers, printers, and mobile phones
- these devices typically have very short lifetimes and are commonly discarded by consumers when newer devices become available. For example, users may discard their mobile phone every two years when they are offered free or discounted equipment to renew their mobile phone contract with their carrier. Consumers also may discard their computers, televisions, and other appliances after only a few years of service, often because it is less expensive to replace than to repair.
- LCA Life Cycle Analysis
- the databases include vast amounts of data that can be useful to manufacturers given the component breakdown of current products. It is said, for example, that a product as simple as a pen can include over 1500 parameters when considered on a cradle-to-grave basis.
- These databases provide no analysis of the data for the manufacturer. For example, while a user may be able to use these databases to check whether the use of a particular plastic might have a bigger impact than another type of plastic, the database still provides no other information that the manufacturer can use to make, e.g., business decisions.
- FIG. 1A is a high-level block-diagram of an example computer system that may implement sub-tree similarity for component substitution.
- FIG. 1B shows an example architecture of machine readable instructions for database program code that may execute program code for determining sub-tree for component substitution.
- FIG. 2A illustrates an example multidimensional data structure.
- FIG. 2B illustrates a plurality of tree structures that may be provided in the data structure.
- FIG. 2C shows an example of a new system tree.
- FIGS. 3A-3B show an example of determining sub-tree for component substitution.
- FIG. 4 is a flowchart illustrating example operations of determining sub-tree for component substitution.
- FIG. 5 is a flowchart illustrating example operations of component substitution which may be implemented.
- a user may use conventional databases to determine whether a component in a product might have a higher price or a bigger impact than another component. But manufacturing decisions can be more complex than this. Manufacturers may take into consideration a wide variety of characteristics of many different components. Other factors that may also be considered include the intended use of the product, availability of components, customer demand, regulations and laws, to name only a few examples.
- the term “includes” means includes but not limited to, the term “including” means including but not limited to.
- the term “based on” means based at least in part on.
- a plastic component for a metal component in a product because it has a lower environmental impact may not be possible based on one or more other consideration.
- a certain type of plastic may indeed have a lower environmental impact, but lacks durability (affecting customer satisfaction and/or warranty). Therefore, the plastic may not be a suitable substitution for the metal component.
- the plastic may be more expensive than the metal, or fail on some other parameter. Decisions to substitute components cannot be made by simply consulting a database, without some analysis of many different information paths.
- systems and methods are provided herein that enable large-scale data analysis to enable informed decisions.
- a system and method described herein enable automated large-scale data analysis. It is noted that although the systems and methods are described herein with reference to the design and manufacture of an electronic device, the systems and methods can broadly be applied to the design and implementation of any of a wide range of different types of devices and/or services (generally referred to herein as the “system under consideration”).
- An example of a system includes a computer readable storage to store at least one system tree having a plurality of nodes.
- the system tree may be stored in a data structure (e.g., a database).
- Each node in the system tree represents a characteristic of a component.
- a system tree for a new computer may include a keyboard node, a motherboard node, a hard disk drive node, and a display node.
- Each node may also include child nodes.
- the motherboard node may also include child nodes for motherboard components, such as the onboard memory, and processor. These nodes may make up so-called “sub-trees.”
- Sub-trees refer to a group of nodes.
- a sub-tree may include all of the nodes of a motherboard (including processor, memory, computer board, etc.).
- Another sub-tree may include all of the nodes of a monitor (including display, housing, cords, etc.).
- the database may include information about price of the product, environmental impact, performance, product warranty, customer satisfaction, among others, for each of the nodes in the tree.
- the information may be referred to generally as “cost.” That is, the term “cost” may include price, carbon footprint, energy consumption (e.g., kilowatt hours), number of warranty calls and/or price associated with those warranty calls, and any other suitable metric for characterizing different components.
- An analysis engine is operatively associated with the computer readable storage to compare the system tree with other trees. For example, the analysis engine may compare a sub-tree of the system tree for the new computer with other sub-trees for other computers or devices. The analysis engine may determine that the other sub-trees (e.g., the motherboard) for a laptop computer, desktop computer, and netbook computer, offer suitable substitutions.
- the other sub-trees e.g., the motherboard
- At least one sub-tree (or node(s) from a sub-tree) may be substituted or replaced in the system tree based on another tree. For example, if the manufacturer is seeking to produce a “green” or “designed for the environment” computer, the motherboard sub-tree or processor node in the system tree may be replaced with the motherboard sub-tree or processor node from one of the more energy efficient laptop or netbook computers.
- Exact correlation of trees is straight-forward. For example, an algorithm based on a depth first search (DFS) traversal of the trees may be used to compare each of the nodes in the trees. Approximate correlation of the trees is a more challenging problem. Further, unordered trees (where the order of the child nodes is insignificant) are harder to correlation than ordered trees. The trees discussed herein are typically unordered, since the order of the child nodes does not matter.
- DFS depth first search
- the systems and methods disclosed herein may be used to compute similarity between sub-trees in databases.
- Techniques which may be implemented include, but are not limited to, a) domain-based rules, b) attribute-based rules, and c) model-based rules.
- two sub-trees are considered similar if they are interchangeable in a tree.
- Techniques and methods disclosed herein may be used to quantitatively determine similarity between two such sub-trees. Further, given a particular sub-trees, these techniques and methods may be used, for example, to obtain a list of k most similar sub-trees or nodes of the sub-trees from a specific database.
- nodes that are found to be similar may also be rated. A higher rating may indicate a better candidate for substitution.
- the motherboard node for the netbook computer may receive a higher rating for price than the desktop computer, because the price of the motherboard in the netbook computer is lower than the price of the motherboard in the desktop computer.
- the motherboard node of the laptop computer may receive a higher rating than the desktop computer for environmental impact, because the processor in the laptop computer is more energy efficient than the processor in the desktop computer.
- the processor in one type of laptop computer may be made of more environmentally friendly components than the processor in another laptop computer.
- the systems and methods provided herein determine sub-tree to enable node comparison. Understanding sub-tree aids in finding suitable substitutions, and for clustering nodes or applying other analysis where a distance metric between nodes can be implemented.
- the node comparison may be utilized for component substitution based on a knowledge base of information for existing components, to meet or exceed customer expectations, marketing goals, environmental impact, and/or other considerations for the system, without the need to develop new components.
- FIG. 1A is a high-level block-diagram of an example computer system 100 which may implement sub-tree for component substitution.
- System 100 may be implemented with any of a wide variety of computing devices, such as, but not limited to, stand-alone desktop/laptop/netbook computers, workstations, server computers, blade servers, mobile devices, and appliances (e.g., devices dedicated to providing a service), to name only a few examples.
- Each of the computing devices may include memory, storage, and a degree of data processing capability at least sufficient to manage a communications connection either directly with one another or indirectly (e.g., via a network).
- At least one of the computing devices is also configured with sufficient processing capability to execute the program code described herein.
- the system 100 may include a host 110 providing a service 105 accessed by a user 101 via a client device 120 .
- the service 105 may be a data processing service executing on a host 110 configured as a server computer with computer-readable storage 112 .
- the client 120 may be any suitable computer or computing device (e.g., a mobile device) capable of accessing the host 110 .
- Host 110 and client 120 are not limited to any particular type of devices. It is also possible for the host 110 and client 120 to be the same device (e.g., a kiosk platform).
- the user interface may be provided on any computing device for providing data to, and receiving data from, service 105 .
- the system 100 may also include a communication network 130 , such as a local area network (LAN) and/or wide area network (WAN).
- the network 130 includes the Internet or other mobile communications network (e.g., a 3G or 4G mobile device network).
- Network 130 provides greater accessibility to the service 105 for use in distributed environments, for example, where more than one user may have input and/or receive output from the service 105 .
- the host 110 is implemented with (or as part of) the service 105 in the networked computer system 100 .
- the service 105 may be a cloud-based service, wherein the host 110 is at least one server computer in a cloud computing system.
- the host 110 may be provided on the network 130 via a communication connection, such as via an Internet service provider (ISP).
- ISP Internet service provider
- the client 120 is able to access host 110 directly via the network 130 , or via an agent, such as a network site.
- the agent may include a web portal on a third-party venue (e.g., a commercial Internet site), which facilitates a connection for one or more clients 120 with host 110 .
- portal icons may be provided (e.g., on third-party venues, pre-installed on a computer or mobile device, etc.) to facilitate a communications connection between the host 110 and client 120 .
- the host 110 is not limited in function.
- the host 110 may also provide other services to other computing or data processing systems or devices in the system 100 .
- host 110 may also provide transaction processing services, email services, etc.
- the host 110 may be operable to communicate with at least one information source 140 .
- the source 140 may be part of the service 105 , and/or the source 140 may be distributed in the network 130 .
- the source 140 may include any suitable source(s) for information about various components.
- the source 140 may include manufacturer specifications, proprietary databases, public databases, and/or a combination of these, to name only a few examples of suitable sources.
- the source 140 may include automatically generated and/or manual user input. If the source 140 includes user-generated data, an appropriate filter may be applied, e.g., to discard “bad” data or misinformation. There is no limit to the type or amount of information that may be provided by the source 140 .
- the information may include unprocessed or “raw” data. Or the data may undergo at least some level of processing.
- the host 110 may execute analytics using the information from the source 140 to generate output for use in component substitution for device manufacture. For example, the host 110 receives information from the source 140 including environmental impact based on a cradle-to-grave assessment for various components. The host 110 may maintain the results in at least one data structure (e.g., a matrix or table or database) in computer-readable media 115 . The data structure may be accessed by the host 110 , which performs analytics based on input by the client 120 , and outputs the results for the user at the client 110 .
- data structure e.g., a matrix or table or database
- the host 110 performs the analytics described herein by executing database program code 150 .
- the database program code 150 may include an analysis engine 152 and a query engine 154 .
- the analytics engine 152 may be integrated into the query engine 154 .
- the analytics engine 152 may be an SQL-based analytics engine, and the query engine 154 may be an SQL query engine.
- the operations described herein are not limited to any specific implementation with any particular type of database.
- a system that implements component substitution for device manufacture as described herein has the capability to take a description of a system under consideration (e.g., in terms of inherent properties of the device), and assess the characteristics (e.g., price, environmental footprint, customer satisfaction, warranty) of the individual components comprising the system under consideration. The system may then output a list of substitute components and/or an assessment of various product designs. Component substitution may be better understood with reference to the following discussion of an example implementation of machine readable instructions.
- FIG. 1B shows an example architecture of machine readable instructions for the database program code 150 which may execute program code for determining sub-tree similarity for component substitution.
- the database program code 150 may be implemented in machine-readable instructions (such as but not limited to, software or firmware) stored on a computer readable medium (e.g., storage 115 in FIG. 1A ) and executable by one or more processor (e.g., on host 110 in FIG. 1A ) to perform the operations described herein.
- the database program code 150 may perform operations on at least one database 160 (or other data structure).
- the database 160 may be provided on the same or different computer readable medium (e.g., storage 115 in FIG. 1A ). It is noted, however, the components shown in FIGS. 1A and 1B are provided only for purposes of illustration of an example operating environment, and are not intended to limit execution to any particular system.
- the analysis engine 152 may be operatively associated with the query engine 154 to execute the function of the architecture of machine readable instructions as self-contained modules. These modules can be integrated within a self-standing tool, or may be implemented as agents that run on top of an existing database. Existing data are used as seed data to populate a matrix. A comparison is then run between the device and the populated matrix using node comparison techniques (and related algorithms). After a set of similar nodes has been identified, trees are constructed to identify the structure resident within the similar nodes. The constructed tree is then compared to the system tree. When a similar tree (or set of trees) has been identified, the tree(s) are assessed for one or more parameter (e.g., environmental footprint).
- one or more parameter e.g., environmental footprint
- one or more node may be substituted in the system tree.
- the offending node(s) may be replaced with potentially better rated nodes, and also assessed to identify a better rated tree.
- the highly-rated tree(s) are used to mine the populated matrix for novel sub-trees from other devices, which may lead to a better rated solution.
- the architecture of machine readable instructions may include a matrix completion module 170 .
- the matrix completion module 170 may populate the database with information related to various devices.
- the information may include price and environmental impact, among other characteristics.
- Existing data from commercial databases, published literature, or internal systems may be used as seed data.
- the seed data is then expanded through one or more of data mining, knowledge discovery, regression, and/or other techniques. In this manner, only a few starting points of readily available data are used initially, and more comprehensive information can be constructed for the database.
- the architecture of machine readable instructions may also include a sub-tree similarity module 171 .
- the sub-tree similarity module 171 may be used to identify relevant characteristics of the device being assessed. These characteristics may be relevant to at least one of the parameters. For example, the published energy use rate for the device is directly related to environmental impact. But the characteristics may also include part name, part number, composition of the device, etc.
- the relevant characteristics of the device are then compared to the matrix of information in the database to identify any similar nodes. These nodes may be considered to be similar at the root (e.g., two different laptop computers), or similar in terms of other relational characteristics (e.g., a computer housing and a printer housing).
- the architecture of machine readable instructions may also include a tree reconstruction module 172 .
- the tree reconstruction module 172 further outlines how the identified nodes are structurally related to one another.
- a root node is detected or inputted, and then the remaining nodes are identified as children or non-children of the root node. Based on the identified children nodes, a hierarchical structure may be generated which is used to construct a tree.
- the architecture of machine readable instructions may also include a tree similarity module 173 . After constructing a tree of relevant nodes from the populated matrix, this tree is then compared to the system tree. The system tree may be assessed, and a bill-of-materials developed for the device. Examples of methods to identify metrics for comparing two trees, include but are not limited to, tree depth, breadth, and distance between relative nodes. The output may include a similarity rating relative to identified trees of relevance in the populated matrix.
- the architecture of machine readable instructions may also include a tree substitution and design module 174 .
- a laptop computer may be identified as being similar to another laptop computer stored in the database.
- the processors of each laptop computer are identified as the offender.
- the processor node in the other laptop tree may be substituted for the processor node in the system tree.
- the new system tree results in a laptop computer having a lower environmental footprint.
- the tree substitution and design module moves on to the next highest offender (e.g., the hard disk drive node), and the process repeats.
- the output results in a new tree for the device having a lower environmental footprint.
- the architecture of machine readable instructions may also include a tree assessment module 175 .
- the tree assessment module 175 may be used to assess a device, rather than redesign the device.
- the total environmental footprint of the tree may be calculated based on the similarity metrics identified by the tree similarity module. Methods to rapidly calculate the footprint of very large trees based on a hierarchy of nodes with similar grouping may be utilized.
- the output of the tree assessment module may include an estimated environmental footprint of the system tree. Additional metrics of relevance may also be output. For example, additional metrics may include but are not limited to, the minimum calculated environmental footprint of substitutive trees, the most similar tree with a lower environmental footprint, and the average footprint of all relevant trees.
- the architecture of machine readable instructions may also include a tree creation module 176 .
- the tree creation module 176 utilizes output from the other modules (e.g., the tree reconstruction module 172 and the tree substitution module 174 ) to create new trees.
- the fundamental principle is that different systems may perform similar functions, but not necessarily be previously viewed in similar fashion. For example, a server computer may use a particular component hierarchy in the supply chain that is also relevant to a laptop computer. But the manufacturer may not have considered such a hierarchy for numerous reasons, not the least of which is the manufacturer's own belief that server computers are different than laptop computers.
- the database 160 may store at least one tree with a plurality of nodes. Each node in the tree represents at least one characteristic of a device.
- the database 160 may include a tree for a new computer.
- the new computer tree 250 may include nodes for the motherboard, the hard disk drive, the keyboard, and the display.
- the motherboard node may include information about cost, e.g., at least one of price, environmental impact, performance, product warranty, and customer satisfaction, among other characteristics of the motherboard.
- the database 160 may be a multidimensional data structure.
- FIG. 2A illustrates an example multidimensional data structure.
- the database is configured as a matrix 200 with information for each node.
- Example information may include, but are not limited to the following characteristics: price, environmental impact, performance, product warranty, and customer satisfaction, to name only a few examples.
- the matrix 200 includes a plurality of columns (A, B, . . . i) and a plurality of rows ( 1 , 2 , . . . j).
- the intersection of each row and column may be referenced by the combination of row label and column label.
- the intersection of column B and row 2 may be referred to as B 2 .
- each row corresponds to a component, and is thus used to generate the nodes in trees.
- the columns correspond to characteristics for the components.
- the intersection B 2 may include environmental impact information (e.g., overall carbon footprint) for the computer display.
- the matrix 200 is not limited to the two-dimensional example given above.
- the program code may go to the intersection B 2 , and then read forward/backward in a third dimension to obtain more detailed environmental impact information included in the overall carbon footprint calculation, such as but not limited to, energy use, toxic emissions, and waste disposal.
- the addresses in the third dimension may be referenced using any suitable symbols, such as subscripts, wherein the address is B 2 1 , B 2 2 , . . . B 2 k .
- the information in the multidimensional data structure may be included in, or referenced by the nodes in the trees.
- a printed circuit board node may reference intersection B 2 in the matrix 200 for environmental impact information related to that particular printed circuit board. It is noted that multiple nodes in different trees may reference the same address in the same matrix 200 .
- the printed circuit board nodes in a plurality of different computer trees may each reference the intersection B 2 in the same matrix 200 , if intersection B 2 includes information for environmental impact that is the same for each printed circuit board.
- the matrix 200 shown in FIG. 2A is shown and described herein as an example data structure that may be used to generate the tree structures shown in FIGS. 2B and 2C . It is noted, however, that the tree structures may be based on information provided in any suitable format(s).
- FIG. 2B illustrates a plurality of tree structures 210 a - e that may be provided in the database.
- the trees 210 a - e each have a plurality of nodes.
- Each node in the tree 210 a - e may further include subnodes, thereby defining a child-parent relationship between the nodes, and providing additional layers of granularity for the components.
- the tree structures 210 a - c are for computer devices. It is noted that any suitable number and type of other trees may be also used.
- tree structure 210 d is for a printer
- tree structure 210 e is for a mobile phone. Accordingly, nodes that are suitable for substitution may be found in system trees that are not necessarily related to one another in a conventional sense.
- a computer is different than a printer in most regards, which is different than a mobile phone. But there may be overlap in at least one of the nodes.
- computers, printers, and mobile phones all have in common a processor, some degree of memory, and a housing.
- all of the trees 210 a - e include motherboard nodes 211 a - e , in addition to nodes for other components. At least some of the other component nodes may be related in the different trees (e.g., nodes 201 a - c are related). At least some of the other component nodes may not be related in the different trees (e.g., node 203 for ink cartridges in the printer tree 210 d and node 204 for the antenna in the mobile phone tree 210 e ).
- motherboard nodes 211 a - c may include subnodes 212 a - c for the circuit boards, subnodes 213 a - c for the onboard memory, and subnodes 214 a - c for the processors. These subnodes are each related to the respective motherboard nodes 211 a - c as child nodes. Furthermore, the child nodes may also have child nodes of their own.
- the circuit board nodes 212 a - c may include child nodes 215 a - c for the wafer and child nodes 216 a - c for the metal traces.
- program code e.g., the database program code 150 in FIGS. 1A and 1B
- a system tree e.g., system tree 210 a in FIG. 2B
- the program code is also executed to identify and analyze other trees (e.g., system trees 210 b - e ).
- the program code traverses the trees and detects at least one root node in each of the trees. For example, the program code may compare nodes of the new system tree 210 a with laptop/netbook computer trees 210 b , desktop computer trees 210 c , printer trees 210 d , and mobile phone trees 210 e .
- Each of the trees may include root nodes for motherboards (nodes 211 a - e in FIG. 2B ). Root nodes may also be identified for one or more subnode. Accordingly, the motherboard node 211 a (and/or the subnodes) in the system tree 210 a for the new system is compared to the motherboard nodes 211 b - e in the other trees 210 b - e.
- the program may also be executed to rate the nodes.
- the nodes may be rated based on information in the database (e.g., in matrix 200 in FIG. 2A ), to determine the suitability of a substitution. In an example, a higher rating may indicate a better candidate for substitution than a lower rating (although the opposite may also be true).
- the motherboard node 211 b of one of the laptop/netbook computer trees 210 b may be assigned a higher rating for price than the motherboard node in the desktop computer trees 210 c , because the price of the motherboard in the netbooks is lower than the price of the motherboard in the desktop computers.
- the motherboard node of the desktop computer trees 210 c may be assigned a higher rating than the netbooks for performance. But the motherboard node 211 b of the laptop/netbook computer trees 210 b may receive higher ratings than the desktop computer trees 210 c for environmental impact, because the processor in the laptop/netbook computers is more energy efficient.
- the processor in one type of laptop computer may be more energy efficient than the processor in another laptop computer, and therefore the motherboard node for one of the laptop computer trees 210 b may receive a higher rating than the motherboard node for the other laptop computers in the same group of trees 210 b .
- the ratings may also be weighted. For example, environmental impact may receive a higher weighting if environmental impact is more pertinent to the user than price.
- FIG. 2C shows an example of a new system tree 220 .
- the new tree 220 is created from the tree 210 a .
- the new tree 220 is created with the node 215 b from the laptop computer tree 210 b because this node has the best rating for environmental impact.
- the new tree 220 is also created with the node 214 c from the desktop computer trees, because this node has the best performance.
- the new tree 220 is also created with the node 212 e from the mobile phone tree because this node has the lowest price.
- the systems and methods may be utilized to provide a quick assessment of a large amount of manufacturing information for a wide variety of different systems, and with high accuracy.
- the systems and methods may be used to modify device manufacture, e.g., by reducing the price to manufacture, reducing the impact the device has on the environment, and reducing warranty calls, all while increasing customer satisfaction with the product.
- These considerations are particularly relevant for so-called “fleet” customers or enterprise customers who purchase in large quantities, and therefore carefully consider the many different impacts of their purchases.
- the systems and methods may be implemented as a product assessment service.
- the systems and methods may be used by enterprises who demand emissions reduction or compliance with environmental goals and/or regulations. Many of these enterprises are turning to their vendors to help assess, monitor, and reduce their environmental footprint.
- the systems and methods not only enable manufacturers to competitively reduce the environmental footprint of their customers, but to also competitively reduce the environmental footprint of their own supply chain.
- the systems and methods also provide the foundation for significant savings, both direct (e.g., supply-side) and indirect (e.g., reducing warranty calls).
- direct e.g., supply-side
- indirect e.g., reducing warranty calls.
- the ability to automate product analysis may be a differentiator for some manufacturers in reducing price for smaller customers, and scaling to meet the demands of larger customers, while maintaining or even growing profit margins.
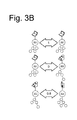
- FIGS. 3A-3B show an example of determining sub-tree similarity for component substitution.
- each entity in the database is referred to as a plurality of related nodes or sub-trees 300 .
- Each node of the sub-trees 300 is associated with a set of attributes.
- the attributes (illustrated by 310 a - d , 311 a - d , 312 a - d , and 313 a - d for nodes 301 - 304 , respectively) may be numerical, discrete, categorical, textual description, visual, auditory, etc.
- Some attributes include, but are not limited to: database source, part number, part name, part description, category, subcategory, trees containing that sub-tree, images, etc.
- the object is to estimate a normalized similarity metric between any two sub-trees belonging to the same or different databases.
- attributes may be analyzed, for example, by comparing at least one measurable aspect.
- Non-limiting examples are comparing text using the longest common string correlation for correlating text strings, and pixel correlation for correlating pictures.
- a similarity metric of zero indicates no correlation (e.g., in no situation can one sub-tree substitute for the other).
- sub-trees including nodes 301 and 303 for the laptop and printer are assigned a similarity metric of zero because the motherboards are not interchangeable (no attributes correlate). Intermediate values between 0 and 1 indicate various degrees of similarity between the nodes.
- sub-trees including nodes 303 and 304 for the printer and a mobile phone are assigned a similarity metric of 0.8 because there are sufficient components on the motherboards of each that have sufficient common attributes, making the motherboards interchangeable for some uses (some attributes correlate).
- Such a tree consists of nodes arranged in a specific topology.
- the similarity (distance) between two trees is a combination of their similarity (distance) in both the nodes and topology.
- a domain-based rules technique may be employed. This technique uses domain knowledge about the databases, the sub-trees within the databases, and any available contextual information, to construct a set of rules. The rules may then be used to determine the similarity between two sub-trees. For purposes of illustration, a simple rule may be defined such that two sub-trees from the same or substantially similar data source and having the same or substantially similar part numbers for the root nodes are assigned a similarity of one. Other rules could exploit specific knowledge of attributes of the root node, child nodes, or the topology of the tree.
- an attribute-based similarity metric may be employed.
- Multivariate attributes typically available for each sub-trees, are used to compute a similarity metric.
- the final similarity metric comprises the similarity in each individual attribute.
- the final similarity metric may include the weighted sum of the similarity of each of the attributes.
- the similarity function for each attribute may be defined by a domain expert.
- similarity between string attributes may be computed from the longest common subsequence (LCS) correlation.
- similarity may be based on longest common prefix (LCP).
- similarity may be based on a combination of LOS and LOP.
- similarity may be computed using Levenshtein distance between strings. Other string correlating algorithms may also be used.
- similarity between numeric attributes may be computed using Minkowski distance.
- the similarity of the individual nodes can be combined together to determine the similarity metric between all the nodes.
- the edit distance between the trees can be considered to estimate the similarity between the topology of two trees.
- the manner of combining the similarity of attributes may also be based on domain knowledge (e.g., determining the weights, if the weighted sum is used).
- the similarity of attributes may also be based on the usage scenario of the similarity metric.
- the similarity metric between two sub-trees may be determined using cosine similarity to compare two vectors of attributes.
- a model-based similarity metric may be employed.
- the similarity between two sub-trees is based on data that is available, such as but not limited to: textual descriptions of each of the sub-trees, a large number of trees consisting of the sub-trees, data where similarity between sub-trees is already known (e.g., has been assigned manually by a domain expert).
- topic models may be constructed for each sub-trees. These models may then be compared to determine the similarity between the sub-trees.
- contextual metrics may be computed for each sub-tree. These metrics pertain to the proximity of other nodes to a given sub-tree. For example, if the parent and children of two nodes are always the same, sub-trees having those nodes are likely to have a high similarity to one another.
- a “labeled” data set is already available.
- the similarity between any two sub-trees in the data set is known.
- Such a data set can be used for training a machine learning model.
- the input to the model includes “features” extracted from the node or topology attributes of the sub-trees.
- the output is the similarity metric.
- a trained model which has learned the relationship between the sub-tree features and the similarity metric, may be used to determine the similarity between two new sub-trees for which the similarity is not known, but the same features can be extracted from their attributes.
- the technique(s) may be used to compute the similarity between any two sub-trees in a database.
- the similarity may then be used to construct a distance matrix between sub-trees of the database.
- the matrix can then be used to perform cluster (or group) analysis.
- the resulting clusters may be manually labeled by a domain expert. Clustering may also be used to approximate correlation of sub-trees in two difference databases that do not share common attributes. Both databases may be separately clustered, and the clusters manually labeled for use. Thus, the task of correlating nodes is reduced to correlating the cluster labels of the two databases.
- FIGS. 4 and 5 are flowcharts illustrating example operations which may be implemented for device manufacture.
- Operations 400 and 500 may be embodied as machine readable instructions on one or more computer-readable medium. When executed on a processor, the instructions cause a general purpose computing device to be programmed as a special-purpose machine that implements the described operations.
- the components and connections depicted in the figures may be used.
- FIG. 4 is a flowchart illustrating example operations of determining sub-tree similarity for component substitution.
- a similarity metric is assigned to a plurality of trees stored in computer-readable media.
- a distance matrix is constructed in computer-readable media, the distance being between sub-trees.
- the sub-trees may be compared using at least one of: domain based rules, attribute based similarity metrics, and machine learning.
- Domain-based rules may use domain knowledge to construct a set of rules based on node attributes.
- Attribute based similarity metrics may be determined based on multivariate attributes for each node.
- Model based similarity may be determined based on available node data.
- a similarity score of one indicates interchangeable nodes.
- a similarity score of zero indicates no correlation.
- sub-trees are correlated (e.g., even between trees without common attributes) based on the distance matrix. Accordingly, the similarity score may be used to compute similarity between any sub-trees in a database. As already noted above, the similarity score may be asymmetric.
- further operations may include rating the nodes based on respective similarity scores, and replacing the at least one of the common nodes in the system tree is based on the rating.
- FIG. 5 is a flowchart illustrating example operations of component substitution which may be implemented.
- operation 510 building a system tree having a plurality of nodes, each node in the system tree representing a characteristic of a component of the system under consideration.
- a tree may be for a new laptop computer.
- the tree may include a motherboard node, a keyboard node, a hard disk drive node, and a display node.
- the keyboard node may further include a housing node, a cabling/wireless node, and a circuit board node.
- the keyboard node is the parent node and the housing node, cabling/wireless node, and circuit board node are child nodes of the keyboard node. Any degree of granularity may be utilized based at least to some extent on design considerations (including desired output, and time to process).
- comparing nodes of the tree with nodes in other trees to identify common nodes (or root or similar node).
- the tree for the new laptop computer may be compared with trees for other computers, such as other laptop computers, netbook computers, desktop computers, servers, server blades, etc.
- the common node may be the keyboard node in each of these other trees. Or the common node may be the circuit board child node for the keyboard node or even the motherboard node.
- the tree for the new laptop computer may also be compared with trees for other, at least somewhat unrelated systems.
- the processor or memory in a mobile phone may be a suitable substitute for the processor or memory in another system, such as a printer.
- generating a new tree for the system under consideration by replacing at least one of the common nodes in the system tree with at least one of the nodes in the other trees.
- the processor from another laptop computer may be substituted for the processor originally chosen for the new laptop computer to give the new laptop computer a lower environmental impact, lower price, higher customer satisfaction, longer warranty, etc. than the initial design for the new laptop computer may have delivered.
- building system trees may be fully automatic using retrieval routines executed by program code.
- at least some user interaction may be provided.
- the user may manually provide production specification(s), and then building system trees may be automatic based at least in part of the user-provided product specification(s).
- the level of user interaction may be any suitable degree.
- the user may simply identify that the new system is to be an inkjet printer.
- the user may identify individual components of the inkjet printer, including but not limited to, the type of ink cartridges, processor speed, memory size, and paper tray options.
- the component substitution operations may be implemented with a customer interface (e.g., web-based product ordering interface).
- the customer is able to make predetermined selections (e.g., specifying minimum processor speed), and the operations 510 - 530 described above are implemented on a back-end device to present the user with various designs that meet the customer's minimum expectations.
- the user can then further select which of the alternatives best suit the customers preferences (including, e.g., for price, environmental impact, customer satisfaction, and warranty).
- Further operations may also include rating the nodes, wherein replacing the at least one of the nodes in the system tree is based on the rating of the nodes. For example, a processor having a higher energy efficiency rating may receive a higher ranking for environmental impact. A processor that is priced lower may receive a higher ranking for price. A processor that has a higher customer satisfaction may receive a higher ranking for customer satisfaction. The rankings may further be weighted. For example, if the user values a lower environmental impact above price, then the rating for environmental impact is assigned a higher weight than price.
- Still further operations may also include populating a database with characteristics of a plurality of components.
- the characteristics of the components may include price, environmental impact of the components, customer satisfaction, warranty, and other characteristics dependent at least to some extent on design considerations.
- Some design considerations may include which characteristics are desired by the user, required by regulation, set forth in company policy, and used to meet manufacturing goals, to name only a few examples.
- Still further operations may also include identifying structural relationships between the plurality of nodes in the system tree and the nodes in the other trees.
- structural relationships may include, but are not limited to, parent-child nodes, and parent-grandchildren nodes.
- Still further operations may also include determining at least one substitute component for the system based on the new tree.
- further operations may include outputting a bill of materials with the at least one substitute component based on the new tree.
- the bill of materials may be printed for a user (e.g., a consumer).
- the bill of materials may be vetted (e.g., by a design engineer) to ensure that any substitutions are appropriate. For example, a high-efficiency processor for a laptop computer may not be an appropriate substitution for a mobile phone.
Abstract
Description
S(T1,T2)=(½)*(S node(T1,T2)+S topo(T1,T2))
S(T1,T2)=(1/(w1+w2))(w1*S node(T1,T2)+w2*S topo(T1,T2))
S(T1,T2)=f(S node(T1,T2),S topo(T1,T2))
S(T1,T2)=(1/Z)ΣWi*si(A1i,A2i)
-
- S( ) is the sub-tree similarity function;
- T1, T2 are the sub-trees;
- Wi is the weight assigned to the ith attribute similarity;
- si( ) is the function that computes the similarity between the sub-trees' ith attribute;
- A1 i, A2 i are the ith attributes of the two sub-trees, respectively; and
- Z is a normalization constant.
S=(A1·A2)/(|A1∥A2|)
Claims (17)
Priority Applications (1)
| Application Number | Priority Date | Filing Date | Title |
|---|---|---|---|
| US13/007,175 US9817918B2 (en) | 2011-01-14 | 2011-01-14 | Sub-tree similarity for component substitution |
Applications Claiming Priority (1)
| Application Number | Priority Date | Filing Date | Title |
|---|---|---|---|
| US13/007,175 US9817918B2 (en) | 2011-01-14 | 2011-01-14 | Sub-tree similarity for component substitution |
Publications (2)
| Publication Number | Publication Date |
|---|---|
| US20120185489A1 US20120185489A1 (en) | 2012-07-19 |
| US9817918B2 true US9817918B2 (en) | 2017-11-14 |
Family
ID=46491566
Family Applications (1)
| Application Number | Title | Priority Date | Filing Date |
|---|---|---|---|
| US13/007,175 Active 2035-02-12 US9817918B2 (en) | 2011-01-14 | 2011-01-14 | Sub-tree similarity for component substitution |
Country Status (1)
| Country | Link |
|---|---|
| US (1) | US9817918B2 (en) |
Families Citing this family (9)
| Publication number | Priority date | Publication date | Assignee | Title |
|---|---|---|---|---|
| US8832012B2 (en) | 2011-01-14 | 2014-09-09 | Hewlett-Packard Development Company, L. P. | System and method for tree discovery |
| US8626693B2 (en) | 2011-01-14 | 2014-01-07 | Hewlett-Packard Development Company, L.P. | Node similarity for component substitution |
| US8730843B2 (en) * | 2011-01-14 | 2014-05-20 | Hewlett-Packard Development Company, L.P. | System and method for tree assessment |
| US9817918B2 (en) | 2011-01-14 | 2017-11-14 | Hewlett Packard Enterprise Development Lp | Sub-tree similarity for component substitution |
| US9589021B2 (en) | 2011-10-26 | 2017-03-07 | Hewlett Packard Enterprise Development Lp | System deconstruction for component substitution |
| GB2510422A (en) * | 2013-02-05 | 2014-08-06 | Inst Of Comp Science | Learning a Bayesian network from data in parallel |
| US11500841B2 (en) * | 2019-01-04 | 2022-11-15 | International Business Machines Corporation | Encoding and decoding tree data structures as vector data structures |
| US11188447B2 (en) * | 2019-03-06 | 2021-11-30 | International Business Machines Corporation | Discovery of computer code actions and parameters |
| US20210073655A1 (en) * | 2019-09-11 | 2021-03-11 | Sap Se | Rule mining for rule and logic statement development |
Citations (66)
| Publication number | Priority date | Publication date | Assignee | Title |
|---|---|---|---|---|
| US5852560A (en) | 1996-05-31 | 1998-12-22 | Kabushiki Kaisha Toshiba | Apparatus for assessing a load that industrial products apply to the environment |
| US6049797A (en) | 1998-04-07 | 2000-04-11 | Lucent Technologies, Inc. | Method, apparatus and programmed medium for clustering databases with categorical attributes |
| WO2000041114A1 (en) | 1999-01-04 | 2000-07-13 | David Saul Glass | Environmental impact and business analysis method using a strategic information system |
| WO2001026044A1 (en) | 1999-10-07 | 2001-04-12 | Oommen John B | A method of comparing the closeness of a target tree to other trees using noisy subsequence tree processing |
| US20020032684A1 (en) | 2000-07-18 | 2002-03-14 | Chieko Kobayashi | Directory information management apparatus, directory information management method, and computer readable recording medium having directory information management program stored therein |
| US6415283B1 (en) | 1998-10-13 | 2002-07-02 | Orack Corporation | Methods and apparatus for determining focal points of clusters in a tree structure |
| US20020099587A1 (en) | 2001-01-19 | 2002-07-25 | Hitachi, Ltd. | Method of support of environmentally concerned design of manufactured goods, and method and system for providing recycling support information |
| US20020116161A1 (en) | 2000-12-28 | 2002-08-22 | Lavelle Freeman | Functional requirement-based knowledge-engineered process for substation design |
| US6490569B1 (en) | 1998-06-22 | 2002-12-03 | Km Ltd. | System for combining life cycle assessment with activity based costing using a relational database software application |
| US6513059B1 (en) * | 2000-08-24 | 2003-01-28 | Cambira Corporation | Adaptive collaborative intelligent network system |
| US6532464B1 (en) | 1998-06-10 | 2003-03-11 | Nec Corporation | Method of assessing environmental load and apparatus of doing the same |
| US6564197B2 (en) | 1999-05-03 | 2003-05-13 | E.Piphany, Inc. | Method and apparatus for scalable probabilistic clustering using decision trees |
| US6691044B2 (en) | 2001-03-28 | 2004-02-10 | Kabushiki Kaisha Toshiba | Product environmental load evaluation method |
| US6742001B2 (en) | 2000-06-29 | 2004-05-25 | Infoglide Corporation | System and method for sharing data between hierarchical databases |
| US6757242B1 (en) | 2000-03-30 | 2004-06-29 | Intel Corporation | System and multi-thread method to manage a fault tolerant computer switching cluster using a spanning tree |
| US20040172442A1 (en) | 2001-06-27 | 2004-09-02 | Ripley John R. | System and Method for Sharing Data Between Hierarchical Databases |
| US20040181526A1 (en) | 2003-03-11 | 2004-09-16 | Lockheed Martin Corporation | Robust system for interactively learning a record similarity measurement |
| US20050021490A1 (en) | 2003-07-25 | 2005-01-27 | Chen Francine R. | Systems and methods for linked event detection |
| US20050027681A1 (en) | 2001-12-20 | 2005-02-03 | Microsoft Corporation | Methods and systems for model matching |
| US6862540B1 (en) | 2003-03-25 | 2005-03-01 | Johnson Controls Technology Company | System and method for filling gaps of missing data using source specified data |
| US20050086208A1 (en) | 2003-10-16 | 2005-04-21 | International Business Machines Corporation | Outer and exception join to inner join normalization |
| US7007069B2 (en) | 2002-12-16 | 2006-02-28 | Palo Alto Research Center Inc. | Method and apparatus for clustering hierarchically related information |
| US7058644B2 (en) | 2002-10-07 | 2006-06-06 | Click Commerce, Inc. | Parallel tree searches for matching multiple, hierarchical data structures |
| US7151752B2 (en) | 2001-05-02 | 2006-12-19 | Canon Kabushiki Kaisha | Method for the broadcasting of a data packet within a switched network based on an optimized calculation of the spanning tree |
| US7197504B1 (en) | 1999-04-23 | 2007-03-27 | Oracle International Corporation | System and method for generating decision trees |
| US7272607B2 (en) | 2002-11-27 | 2007-09-18 | Zyvex Labs, Llc | System and method for processing a hierarchical data tree |
| US7287026B2 (en) | 2002-04-05 | 2007-10-23 | Oommen John B | Method of comparing the closeness of a target tree to other trees using noisy sub-sequence tree processing |
| US20070260595A1 (en) * | 2006-05-02 | 2007-11-08 | Microsoft Corporation | Fuzzy string matching using tree data structure |
| US7310624B1 (en) | 2000-05-02 | 2007-12-18 | International Business Machines Corporation | Methods and apparatus for generating decision trees with discriminants and employing same in data classification |
| US20070294291A1 (en) | 2004-09-30 | 2007-12-20 | Tomoyo Sasaki | Environment Load Totalizing Device and Method |
| US7366110B2 (en) | 2004-09-30 | 2008-04-29 | Avaya Technology Corp. | Method and apparatus for merging call components during call reconstruction |
| US20080154926A1 (en) | 2002-12-16 | 2008-06-26 | Newman Paula S | System And Method For Clustering Nodes Of A Tree Structure |
| US7415418B2 (en) | 2003-02-10 | 2008-08-19 | South Dakota School Of Mines And Technology | Method and apparatus for generating standardized environmental benefit credits |
| US20080250357A1 (en) * | 2007-04-09 | 2008-10-09 | Microsoft Corporation | Visualizing differences in similarity metrics of hierarchies |
| US20090083390A1 (en) | 2007-09-24 | 2009-03-26 | The Research Foundation Of State University Of New York | Automatic clustering for self-organizing grids |
| US20090125529A1 (en) | 2007-11-12 | 2009-05-14 | Vydiswaran V G Vinod | Extracting information based on document structure and characteristics of attributes |
| US7536476B1 (en) | 2002-12-20 | 2009-05-19 | Cisco Technology, Inc. | Method for performing tree based ACL lookups |
| US20090248624A1 (en) | 2008-03-25 | 2009-10-01 | Microsoft Corporation | Functional updates for tree processing |
| US7620632B2 (en) | 2004-06-30 | 2009-11-17 | Skyler Technology, Inc. | Method and/or system for performing tree matching |
| US7634464B2 (en) | 2006-06-14 | 2009-12-15 | Microsoft Corporation | Designing record matching queries utilizing examples |
| US20090313041A1 (en) | 2002-12-10 | 2009-12-17 | Jeffrey Scott Eder | Personalized modeling system |
| US7668100B2 (en) | 2005-06-28 | 2010-02-23 | Avaya Inc. | Efficient load balancing and heartbeat mechanism for telecommunication endpoints |
| US20100076687A1 (en) | 2008-09-25 | 2010-03-25 | Xerox Corporation | Document management environmental footprint calculator |
| US20100100403A1 (en) | 2008-10-20 | 2010-04-22 | Metafore | Method and apparatus for tracking and analyzing environmental impact of producing paper |
| US7707085B2 (en) | 2000-09-21 | 2010-04-27 | Ricoh Company, Ltd. | System and method for providing environmental impact information, recording medium recording the information, and computer data signal |
| US7725499B1 (en) * | 2007-02-01 | 2010-05-25 | Star Ag | Semantic architecture for managing information through structured storage and retrieval |
| US20100145629A1 (en) | 2008-05-12 | 2010-06-10 | Energy And Power Solutions, Inc. | Systems and methods for assessing and optimizing energy use and environmental impact |
| US20100165886A1 (en) | 2008-12-31 | 2010-07-01 | Paul Borrill | Self-Healing Communication Trees |
| US20100179794A1 (en) | 2009-01-13 | 2010-07-15 | Shah Amip J | Multi-variable control-based optimization to achieve target goal |
| US20100223211A1 (en) | 2000-10-11 | 2010-09-02 | Johnson Gregory A | Decision service method and system |
| US20100235300A1 (en) | 2002-03-11 | 2010-09-16 | Vincent Feingold | System and method for multi-layer risk analysis |
| US7801878B2 (en) | 2000-12-18 | 2010-09-21 | Powerloom Corporation | Method and system for approximate matching of data records |
| US7831416B2 (en) | 2007-07-17 | 2010-11-09 | Caterpillar Inc | Probabilistic modeling system for product design |
| US20100332475A1 (en) | 2009-06-25 | 2010-12-30 | University Of Tennessee Research Foundation | Method and apparatus for predicting object properties and events using similarity-based information retrieval and modeling |
| US20100332444A1 (en) | 2009-06-30 | 2010-12-30 | International Business Machines Corporation | Automatic designing system, automatic designing method and automatic designing program for automatically designing architecture for system components |
| US7958257B2 (en) | 2005-01-19 | 2011-06-07 | International Business Machines Corporation | Message filtering and demultiplexing system |
| US20110161311A1 (en) | 2009-12-28 | 2011-06-30 | Yahoo! Inc. | Search suggestion clustering and presentation |
| US20110173197A1 (en) | 2010-01-12 | 2011-07-14 | Yahoo! Inc. | Methods and apparatuses for clustering electronic documents based on structural features and static content features |
| US20110307468A1 (en) | 2010-06-11 | 2011-12-15 | International Business Machines Corporation | System and method for identifying content sensitive authorities from very large scale networks |
| US8145732B2 (en) | 2005-11-21 | 2012-03-27 | Intel Corporation | Live network configuration within a link based computing system |
| US20120106367A1 (en) * | 2010-10-30 | 2012-05-03 | Barkol Omer | Determining a similarity between tree related structures |
| US20120185508A1 (en) | 2011-10-26 | 2012-07-19 | Shah Amip J | System deconstruction for component substitution |
| US20120185489A1 (en) | 2011-01-14 | 2012-07-19 | Shah Amip J | Sub-tree similarity for component substitution |
| US20120185477A1 (en) | 2011-01-14 | 2012-07-19 | Shah Amip J | System and method for supplying missing impact factors in a database |
| US20120185422A1 (en) | 2011-01-14 | 2012-07-19 | Shah Amip J | Node similarity for component substitution |
| US8352465B1 (en) * | 2009-09-03 | 2013-01-08 | Google Inc. | Grouping of image search results |
-
2011
- 2011-01-14 US US13/007,175 patent/US9817918B2/en active Active
Patent Citations (67)
| Publication number | Priority date | Publication date | Assignee | Title |
|---|---|---|---|---|
| US5852560A (en) | 1996-05-31 | 1998-12-22 | Kabushiki Kaisha Toshiba | Apparatus for assessing a load that industrial products apply to the environment |
| US6049797A (en) | 1998-04-07 | 2000-04-11 | Lucent Technologies, Inc. | Method, apparatus and programmed medium for clustering databases with categorical attributes |
| US6532464B1 (en) | 1998-06-10 | 2003-03-11 | Nec Corporation | Method of assessing environmental load and apparatus of doing the same |
| US6490569B1 (en) | 1998-06-22 | 2002-12-03 | Km Ltd. | System for combining life cycle assessment with activity based costing using a relational database software application |
| US6415283B1 (en) | 1998-10-13 | 2002-07-02 | Orack Corporation | Methods and apparatus for determining focal points of clusters in a tree structure |
| WO2000041114A1 (en) | 1999-01-04 | 2000-07-13 | David Saul Glass | Environmental impact and business analysis method using a strategic information system |
| US7197504B1 (en) | 1999-04-23 | 2007-03-27 | Oracle International Corporation | System and method for generating decision trees |
| US6564197B2 (en) | 1999-05-03 | 2003-05-13 | E.Piphany, Inc. | Method and apparatus for scalable probabilistic clustering using decision trees |
| WO2001026044A1 (en) | 1999-10-07 | 2001-04-12 | Oommen John B | A method of comparing the closeness of a target tree to other trees using noisy subsequence tree processing |
| US6757242B1 (en) | 2000-03-30 | 2004-06-29 | Intel Corporation | System and multi-thread method to manage a fault tolerant computer switching cluster using a spanning tree |
| US7310624B1 (en) | 2000-05-02 | 2007-12-18 | International Business Machines Corporation | Methods and apparatus for generating decision trees with discriminants and employing same in data classification |
| US6742001B2 (en) | 2000-06-29 | 2004-05-25 | Infoglide Corporation | System and method for sharing data between hierarchical databases |
| US20020032684A1 (en) | 2000-07-18 | 2002-03-14 | Chieko Kobayashi | Directory information management apparatus, directory information management method, and computer readable recording medium having directory information management program stored therein |
| US6513059B1 (en) * | 2000-08-24 | 2003-01-28 | Cambira Corporation | Adaptive collaborative intelligent network system |
| US7707085B2 (en) | 2000-09-21 | 2010-04-27 | Ricoh Company, Ltd. | System and method for providing environmental impact information, recording medium recording the information, and computer data signal |
| US20100223211A1 (en) | 2000-10-11 | 2010-09-02 | Johnson Gregory A | Decision service method and system |
| US7801878B2 (en) | 2000-12-18 | 2010-09-21 | Powerloom Corporation | Method and system for approximate matching of data records |
| US20020116161A1 (en) | 2000-12-28 | 2002-08-22 | Lavelle Freeman | Functional requirement-based knowledge-engineered process for substation design |
| US20020099587A1 (en) | 2001-01-19 | 2002-07-25 | Hitachi, Ltd. | Method of support of environmentally concerned design of manufactured goods, and method and system for providing recycling support information |
| US6691044B2 (en) | 2001-03-28 | 2004-02-10 | Kabushiki Kaisha Toshiba | Product environmental load evaluation method |
| US7151752B2 (en) | 2001-05-02 | 2006-12-19 | Canon Kabushiki Kaisha | Method for the broadcasting of a data packet within a switched network based on an optimized calculation of the spanning tree |
| US20040172442A1 (en) | 2001-06-27 | 2004-09-02 | Ripley John R. | System and Method for Sharing Data Between Hierarchical Databases |
| US20050027681A1 (en) | 2001-12-20 | 2005-02-03 | Microsoft Corporation | Methods and systems for model matching |
| US20100235300A1 (en) | 2002-03-11 | 2010-09-16 | Vincent Feingold | System and method for multi-layer risk analysis |
| US7287026B2 (en) | 2002-04-05 | 2007-10-23 | Oommen John B | Method of comparing the closeness of a target tree to other trees using noisy sub-sequence tree processing |
| US7058644B2 (en) | 2002-10-07 | 2006-06-06 | Click Commerce, Inc. | Parallel tree searches for matching multiple, hierarchical data structures |
| US7272607B2 (en) | 2002-11-27 | 2007-09-18 | Zyvex Labs, Llc | System and method for processing a hierarchical data tree |
| US20090313041A1 (en) | 2002-12-10 | 2009-12-17 | Jeffrey Scott Eder | Personalized modeling system |
| US7007069B2 (en) | 2002-12-16 | 2006-02-28 | Palo Alto Research Center Inc. | Method and apparatus for clustering hierarchically related information |
| US20080154926A1 (en) | 2002-12-16 | 2008-06-26 | Newman Paula S | System And Method For Clustering Nodes Of A Tree Structure |
| US7536476B1 (en) | 2002-12-20 | 2009-05-19 | Cisco Technology, Inc. | Method for performing tree based ACL lookups |
| US7415418B2 (en) | 2003-02-10 | 2008-08-19 | South Dakota School Of Mines And Technology | Method and apparatus for generating standardized environmental benefit credits |
| US20040181526A1 (en) | 2003-03-11 | 2004-09-16 | Lockheed Martin Corporation | Robust system for interactively learning a record similarity measurement |
| US6862540B1 (en) | 2003-03-25 | 2005-03-01 | Johnson Controls Technology Company | System and method for filling gaps of missing data using source specified data |
| US20050021490A1 (en) | 2003-07-25 | 2005-01-27 | Chen Francine R. | Systems and methods for linked event detection |
| US20050086208A1 (en) | 2003-10-16 | 2005-04-21 | International Business Machines Corporation | Outer and exception join to inner join normalization |
| US20100094885A1 (en) | 2004-06-30 | 2010-04-15 | Skyler Technology, Inc. | Method and/or system for performing tree matching |
| US7620632B2 (en) | 2004-06-30 | 2009-11-17 | Skyler Technology, Inc. | Method and/or system for performing tree matching |
| US20070294291A1 (en) | 2004-09-30 | 2007-12-20 | Tomoyo Sasaki | Environment Load Totalizing Device and Method |
| US7366110B2 (en) | 2004-09-30 | 2008-04-29 | Avaya Technology Corp. | Method and apparatus for merging call components during call reconstruction |
| US7958257B2 (en) | 2005-01-19 | 2011-06-07 | International Business Machines Corporation | Message filtering and demultiplexing system |
| US7668100B2 (en) | 2005-06-28 | 2010-02-23 | Avaya Inc. | Efficient load balancing and heartbeat mechanism for telecommunication endpoints |
| US8145732B2 (en) | 2005-11-21 | 2012-03-27 | Intel Corporation | Live network configuration within a link based computing system |
| US20070260595A1 (en) * | 2006-05-02 | 2007-11-08 | Microsoft Corporation | Fuzzy string matching using tree data structure |
| US7634464B2 (en) | 2006-06-14 | 2009-12-15 | Microsoft Corporation | Designing record matching queries utilizing examples |
| US7725499B1 (en) * | 2007-02-01 | 2010-05-25 | Star Ag | Semantic architecture for managing information through structured storage and retrieval |
| US20080250357A1 (en) * | 2007-04-09 | 2008-10-09 | Microsoft Corporation | Visualizing differences in similarity metrics of hierarchies |
| US7831416B2 (en) | 2007-07-17 | 2010-11-09 | Caterpillar Inc | Probabilistic modeling system for product design |
| US20090083390A1 (en) | 2007-09-24 | 2009-03-26 | The Research Foundation Of State University Of New York | Automatic clustering for self-organizing grids |
| US20090125529A1 (en) | 2007-11-12 | 2009-05-14 | Vydiswaran V G Vinod | Extracting information based on document structure and characteristics of attributes |
| US20090248624A1 (en) | 2008-03-25 | 2009-10-01 | Microsoft Corporation | Functional updates for tree processing |
| US20100145629A1 (en) | 2008-05-12 | 2010-06-10 | Energy And Power Solutions, Inc. | Systems and methods for assessing and optimizing energy use and environmental impact |
| US20100076687A1 (en) | 2008-09-25 | 2010-03-25 | Xerox Corporation | Document management environmental footprint calculator |
| US20100100403A1 (en) | 2008-10-20 | 2010-04-22 | Metafore | Method and apparatus for tracking and analyzing environmental impact of producing paper |
| US20100165886A1 (en) | 2008-12-31 | 2010-07-01 | Paul Borrill | Self-Healing Communication Trees |
| US20100179794A1 (en) | 2009-01-13 | 2010-07-15 | Shah Amip J | Multi-variable control-based optimization to achieve target goal |
| US20100332475A1 (en) | 2009-06-25 | 2010-12-30 | University Of Tennessee Research Foundation | Method and apparatus for predicting object properties and events using similarity-based information retrieval and modeling |
| US20100332444A1 (en) | 2009-06-30 | 2010-12-30 | International Business Machines Corporation | Automatic designing system, automatic designing method and automatic designing program for automatically designing architecture for system components |
| US8352465B1 (en) * | 2009-09-03 | 2013-01-08 | Google Inc. | Grouping of image search results |
| US20110161311A1 (en) | 2009-12-28 | 2011-06-30 | Yahoo! Inc. | Search suggestion clustering and presentation |
| US20110173197A1 (en) | 2010-01-12 | 2011-07-14 | Yahoo! Inc. | Methods and apparatuses for clustering electronic documents based on structural features and static content features |
| US20110307468A1 (en) | 2010-06-11 | 2011-12-15 | International Business Machines Corporation | System and method for identifying content sensitive authorities from very large scale networks |
| US20120106367A1 (en) * | 2010-10-30 | 2012-05-03 | Barkol Omer | Determining a similarity between tree related structures |
| US20120185489A1 (en) | 2011-01-14 | 2012-07-19 | Shah Amip J | Sub-tree similarity for component substitution |
| US20120185477A1 (en) | 2011-01-14 | 2012-07-19 | Shah Amip J | System and method for supplying missing impact factors in a database |
| US20120185422A1 (en) | 2011-01-14 | 2012-07-19 | Shah Amip J | Node similarity for component substitution |
| US20120185508A1 (en) | 2011-10-26 | 2012-07-19 | Shah Amip J | System deconstruction for component substitution |
Non-Patent Citations (24)
| Title |
|---|
| "Eco-indicator 95" available at http://www.pre.nl/eco-indicator95/eco-indicator95.htm#Background. |
| Boriah, Similarity Measures for Categorical Data: A Comparative Evaluation, 2008 (12 pages). |
| Bouley, Dennis, "Estimating a Data Center's Electrical Carbon Footprint," research paper. |
| Cai and Yau, "Categorical Clustering by Converting Associated Information," Publication Date: 2006; pp. 31-36. |
| Cai, et al., "A Singular Value Thresholding Algorithm for Matrix Completion." |
| Cheng, et al., "A Web Service Framework for Environmental and Carbon Footprint Monitoring in Construction Supply Chains," available at http://eil.stanford.edu/publications/jack-cheng/jack-greenSCOR-web-final.pdf. |
| Cheng, et al., "A Web Service Framework for Environmental and Carbon Footprint Monitoring in Construction Supply Chains," available at http://eil.stanford.edu/publications/jack—cheng/jack—greenSCOR—web—final.pdf. |
| Delisle, R., et al., Induction of Decision Trees via Evolutionary Programming, J. Chem., Inf. Comput. Sci. 2004, 44, pp. 862-870. |
| Gautam, et al. "Context-based Similarity Measures for Categorical Databases," Publication Date: 2000; pp. 201-210. |
| Haung, X., et al., "Clustering Graphs for Vizualization via Node Similarities", Journal of Visual Languages and Computing, 17, 2006, 225-253. |
| Jeong Min Moon, et al., "Life Cycle Assessment Through On-Line Database Linked with Various Enterprise Database Systems," The International Journal of Life Cycle Assessment, vol. 12, No. 7, 488-496, DOI: 10, 1065/lca2006.10.276, Publication Date: 2003; vol. 8; on pp. 226-234. |
| Koutitas; "Low Carbon Network Planning," Apr. 12-15, 2010; pp. 411-417. |
| Laurin, L.; et al., "Automated LCA-A Practical Solution for Electronics Manufacturers," http://www.ieeexplore.ieee.org/xpl/mostRecentIssue.jsp?punumber=10977, May 8-11, 2006. |
| Romanowski, "A Data Mining Approach to Forming Generic Bills of Materials in Support of Variant Design Activities." |
| Romanowski, "On Comparing Bills of Materials: a Similarity/distance Measure for Unordered Trees." |
| Romanowski, C., et al., "Data Mining in an Engineering Design Environment: OR Applications from Graph Matching", Computers & Operations Research, 33, 2006, pp. 3150-3160. |
| Ross, et al. "Collaborative Filtering and Carbon Footprint Calculation," Department of Informatics, May 17-19, 2010, pp. 1-6, University of California. |
| Shasha, Correspondence-Exact and Approximate Algorithms for Unordered Tree Matching, IEEE Transactions on Systems, Man, and Cybernetics, vol. 24, No. 4, Apr. 1994 (11 pages). |
| Shasha, Correspondence—Exact and Approximate Algorithms for Unordered Tree Matching, IEEE Transactions on Systems, Man, and Cybernetics, vol. 24, No. 4, Apr. 1994 (11 pages). |
| Sundaravaradan, N., et al., "Data Mining Approaches for Life Cycle Assessment", IEEE ISSST, May 16-18, 2011. |
| Sundaravaradan, N., et al., "Discovering Life Cycle Assessment Trees from Impact Factor Databases", Proceedings of the Twenty-Fifth AAAI Conference on Artificial Intelligence, pp. 1415-1420, Aug. 7-11, 2011. |
| Sustainable Minds Release 1.0 Offers Product Life Cycle Assessment for Autodesk lnventor Users Import of Bill of Materials Data Providers Seamless Interoperability, http://www.pitchengine.com/pitch/30787, Oct. 27. 2009. |
| Tae-Wan Ryu and Eick, "Similarity Measures for Multi-valued Attributes for Database Clustering," available at http://citeseerx.ist.psu.edu/viewdoc/download?doi=10.1.1.54.3544&rep=rep1&type=pdf. |
| Torsello, "Four Metrics for Efficiently Comparing Attributed Trees," Aug. 23-26, 2004, vol. 2, pp. 467-470. |
Also Published As
| Publication number | Publication date |
|---|---|
| US20120185489A1 (en) | 2012-07-19 |
Similar Documents
| Publication | Publication Date | Title |
|---|---|---|
| US8626693B2 (en) | Node similarity for component substitution | |
| US9817918B2 (en) | Sub-tree similarity for component substitution | |
| US9053438B2 (en) | Energy consumption analysis using node similarity | |
| US20120185477A1 (en) | System and method for supplying missing impact factors in a database | |
| Teunter et al. | Dynamic lot sizing with product returns and remanufacturing | |
| US8190992B2 (en) | Grouping and display of logically defined reports | |
| US20160371288A1 (en) | Use of context-dependent statistics to suggest next steps while exploring a dataset | |
| US20120317142A1 (en) | Systmen and method for data management in large data networks | |
| US20090099920A1 (en) | Data Mining | |
| US9589021B2 (en) | System deconstruction for component substitution | |
| US20120239596A1 (en) | Classification of stream-based data using machine learning | |
| CN104102670A (en) | Performance indicator analytical framework | |
| US20110082820A1 (en) | Assessing an environmental footprint of an object | |
| AU2022215302A1 (en) | Matching adopting users and contributing users for decentralized software localization | |
| US8832012B2 (en) | System and method for tree discovery | |
| US8730843B2 (en) | System and method for tree assessment | |
| US11663023B2 (en) | Systems and methods for dynamic artificial intelligence (AI) graphical user interface (GUI) generation | |
| US20210090105A1 (en) | Technology opportunity mapping | |
| US8935653B2 (en) | System advisor for requirements gathering and analysis in web solutions | |
| US20120185483A1 (en) | System and method for tree creation | |
| CN113255925A (en) | Data-driven online score caching for machine learning | |
| US20150206158A1 (en) | System and method for spend analysis of the service category | |
| US7149739B1 (en) | System and method for performing ratio planning | |
| US20120182904A1 (en) | System and method for component substitution | |
| Yang et al. | On the diversity and explainability of recommender systems: A practical framework for enterprise app recommendation |
Legal Events
| Date | Code | Title | Description |
|---|---|---|---|
| AS | Assignment |
Owner name: HEWLETT-PACKARD DEVELOPMENT COMPANY, L.P., TEXAS Free format text: ASSIGNMENT OF ASSIGNORS INTEREST;ASSIGNORS:SHAH, AMIP J.;MARWAH, MANISH;SIGNING DATES FROM 20110112 TO 20110113;REEL/FRAME:025666/0809 |
|
| AS | Assignment |
Owner name: HEWLETT PACKARD ENTERPRISE DEVELOPMENT LP, TEXAS Free format text: ASSIGNMENT OF ASSIGNORS INTEREST;ASSIGNOR:HEWLETT-PACKARD DEVELOPMENT COMPANY, L.P.;REEL/FRAME:037079/0001 Effective date: 20151027 |
|
| STCF | Information on status: patent grant |
Free format text: PATENTED CASE |
|
| MAFP | Maintenance fee payment |
Free format text: PAYMENT OF MAINTENANCE FEE, 4TH YEAR, LARGE ENTITY (ORIGINAL EVENT CODE: M1551); ENTITY STATUS OF PATENT OWNER: LARGE ENTITY Year of fee payment: 4 |