How do you present data on a Gantt chart?
Slide Marvels - Presentation Design Company
![Slide Marvels - Presentation Design Company]()
Slide Marvels - Presentation Design Company
Top Presentation Designers Helping to Deliver Your Message (run by ex-McKinsey designers)
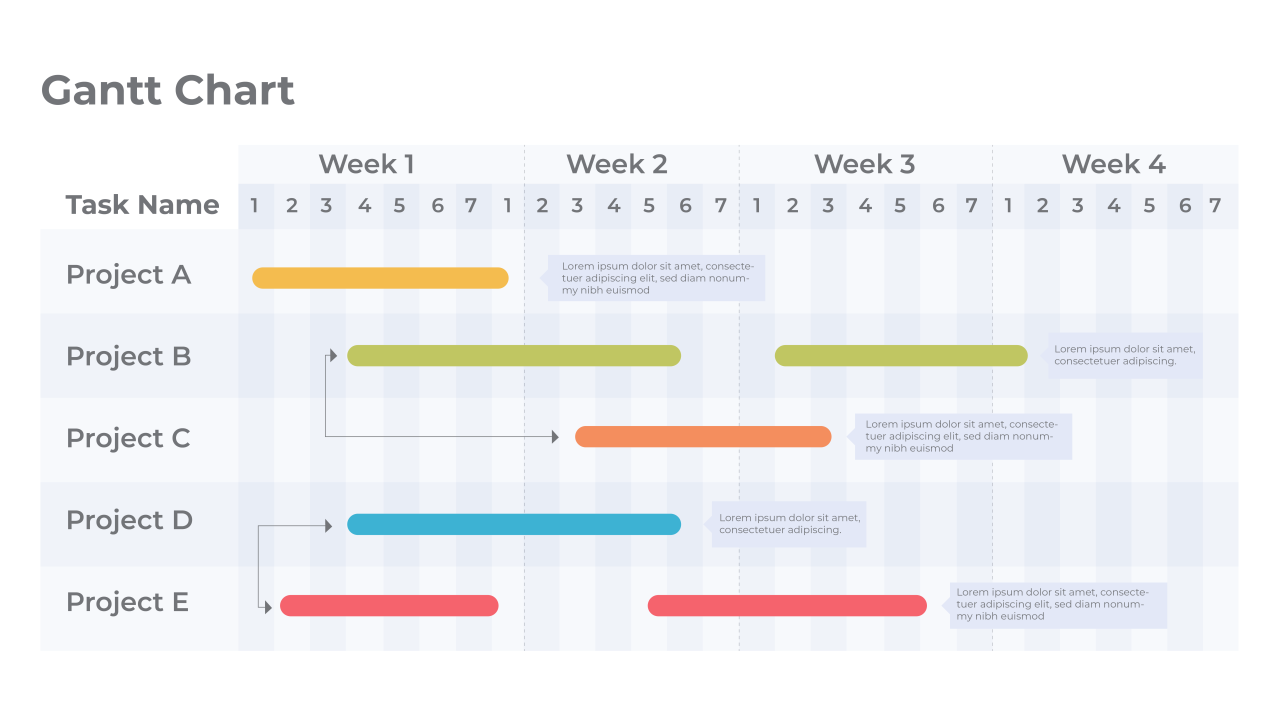
Presenting data on a Gantt chart involves the following steps:
- Determine the scope of the project: Before creating the Gantt chart, you need to determine the scope of the project, including its start and end dates, milestones, and key deliverables.
- Break down the project into tasks: Divide the project into smaller, more manageable tasks that can be tracked and measured. Assign start and end dates to each task, and determine the dependencies between them.
- Create the Gantt chart: Using a spreadsheet or project management software, create a Gantt chart that visually represents the project timeline. Each task should be represented by a horizontal bar that spans the duration of the task.
- Add additional information: To make the chart more informative, you can add additional information such as task descriptions, responsible parties, and status updates.
- Update the chart regularly: As the project progresses, update the Gantt chart to reflect any changes in task status or duration. This will help you stay on top of the project and ensure that you are meeting your goals and deadlines.
- Communicate the Gantt chart: Once the Gantt chart is complete, share it with the project team and stakeholders to ensure that everyone is on the same page regarding the project timeline and progress.
#presentation #powerpoint #mckinsey #slidemarvels #managementconsultant #managementconsulting #presentationdesign #businesspresentation #ppt #slides #slideshow #slideshowtemplate #slidedesign #deck #bcg #deloitte #gantt #ganttchart