Children’s Active Mobility to School: Evidence from Two Andean Cities


1
LlactaLAB—Departamento Interdisciplinario de Espacio y Población, Facultad de Arquitectura y Urbanismo, Universidad de Cuenca, Cuenca 010203, Ecuador
2
Escuela de Arquitectura, Universidad del Azuay, Cuenca 010204, Ecuador
3
Escuela de Arquitectura, Diseño y Artes, Pontificia Universidad Católica del Ecuador Sede Ibarra, Ibarra 100112, Ecuador
4
Instituto de Estudios de Régimen Seccional del Ecuador (IERSE), Facultad de Ciencia y Tecnología, Universidad del Azuay, Cuenca 010204, Ecuador
*
Author to whom correspondence should be addressed.
Sustainability 2024, 16(7), 2745; https://doi.org/10.3390/su16072745
Submission received: 2 March 2024
/
Revised: 18 March 2024
/
Accepted: 19 March 2024
/
Published: 26 March 2024
(This article belongs to the Section Sustainable Urban and Rural Development)
Abstract
:Active mobility to school (AMS) has been identified as a pivotal element in promoting health and physical activity during childhood, adolescence, and beyond. However, the importance of AMS is often downplayed or disregarded in urban and transportation planning, especially in Latin American cities. Factors such as cultural and political dynamics, socioeconomic conditions, urban and social environments, household and individual characteristics, and parental perceptions and attitudes collectively shape the mobility behavior of schoolchildren. This research analyzes the outcomes of a study on AMS at public schools in Cuenca and Ibarra (Ecuador), through the lens of the Socio-Ecological Model framework. The findings show that 47% of students from schools in Cuenca and 26% from Ibarra engage in active commuting to school for at least part of their journey. Key factors correlated with AMS include gender (individual dimension), travel duration, household socioeconomic characteristics, and parental attitudes towards active mobility (household dimension), as well as street-level attributes and land use density surrounding schools (urban environment dimension). This study offers three significant contributions: a detailed portrayal of student mobility behavior at six public schools in Cuenca and Ibarra, an exploration of the factors linked with active commuting, and a methodology for estimating land-use parameters.
1. Introduction
In recent years, sustainable and active urban mobility has gained significant attention due to its crucial role in promoting health, protecting the environment, and enhancing the overall quality of urban life. This topic has been extensively studied across various disciplines, including health, education, geography, data science, architecture, and urbanism. Researchers have consistently found a relationship between the characteristics of the urban built environment and people’s movement patterns [1,2,3].
However, one aspect of urban mobility that has received less emphasis is children’s commuting to and from school. Active mobility to and from school (AMS) is recognized as a crucial factor in fostering healthy and active behaviors during childhood and adolescence and throughout one’s lifetime [4]. Environments discouraging physical activity can impede individuals’ access to the benefits of an active lifestyle, such as maintaining a healthy body composition, preventing obesity and diabetes, and improving cardiovascular fitness [5]. Numerous studies have shown that schools situated in inadequate urban environments are associated with lower levels of children’s active mobility [6,7]. Evidence from the literature indicates that decisions regarding the mobility of school-age children are primarily made by parents, who are influenced by factors such as preferred routes, schedules, and their perceptions of the surrounding environment [6,8]. Therefore, parents play a critical role in shaping their children’s commuting choices and determining the modes of transportation they use to travel to and from school.
Unfortunately, mobility and transportation planning often overlook or underestimate the importance of AMS, particularly in Latin American cities. Even though this region has the highest urbanization rate globally, with over 180 million children and adolescents attending school [9], it remains underrepresented in the published literature. Moreover, only a few studies have explored mobility to schools in Latin America [10,11,12].
In this context, the present study aims to contribute to the existing knowledge about active mobility to school in Latin America by investigating a range of factors from individual, familial, and urban perspectives that influence children’s active commuting to school in the cities of Cuenca and Ibarra, Ecuador. The study adopts the Socio-Ecological Model as a theoretical framework to comprehensively explore the multiple influences on AMS in these specific urban contexts. By examining these factors, the research intends to provide a nuanced understanding of the various barriers and opportunities associated with children’s mobility to school in the region. We hope the findings of this study will be a valuable resource for policymakers, practitioners, and researchers working towards promoting sustainable and active modes of transportation in Latin America.
2. Related Work
2.1. The Socio-Ecological Model of Children’s Mobility
The mobility patterns of school-age children pose inherent complexity, as the decision making process is predominantly influenced by parents. Factors such as preferred routes, schedules, and perceptions of the surrounding environment shape these decisions [6,8]. To navigate this complexity, several theoretical frameworks have been developed. The Socio-Ecological Model—SEM—is one such framework that has garnered attention in recent years [13]. This model recognizes the interplay between individual, social, and environmental factors in shaping children’s mobility behaviors (Figure 1).
The following subsections report the relevant research for some of the different factors related to children’s active mobility to school included in the SEM. The last subsection presents some of the few studies conducted in Latin America.
2.2. Parental Perceptions about Active Mobility to School
Parents’ perceptions of the neighborhood where children move often tend to be more negative compared to their children’s perceptions [14]. Depending on the spatial, social, and cultural context, parents can become “risk experts” and impose limits on their children’s mobility based on their subjective judgments [15].
Convenience and weather are additional factors influencing parents’ and children’s decisions regarding active mobility to and from school (AMS). In terms of convenience, when the school is located close to the parent’s route to work, the child often tends to have limited independent mobility [16]. As for weather conditions, studies have shown that rain and snow can act as barriers to active mobility in certain regions such as Ontario [17], and factors like temperature, wind, high solar radiation hours, and haze can hinder AMS in the southeast of Spain [18]. However, it is important to note that the influence of convenience and weather on mobility decisions is context-dependent. Some authors, such as Buliung et al. [19] and Davison et al. [6], argue that climate and temperature do not always significantly impact mobility decisions.
2.3. Safety and Security
One primary barrier hindering children’s AMS is parents’ perception of road safety and personal security. The level of active mobility is directly related to the perception of safety. Studies conducted in various regions have consistently shown similar results in this regard. For example, parents in Spain [18,20], Chile [10], and New Zealand [21] express significant concerns about the safety of their children when it comes to allowing them to travel on foot or by bicycle. Consequently, when parents have a low perception of safety, they tend to reduce the independence given to their children, which subsequently decreases their active mobility [6].
2.4. Distance
The distance between home and school is a significant barrier that influences parents’ decision to allow AMS, and studies in several regions around the world provide evidence of an inverse relationship between them [6,17,18,20,21,22,23,24]. In particular, Ferri-García et al. [18] and Rojas-López and Wong [23] found that school children who live up to 1.6 km from school are more likely to engage in walking or cycling as their mode of transportation. In Spain, Rodríguez-López et al. [25] found that the threshold distance for walking to school is approximately 1.35 km for urban adolescents (between 15 and 20 min, approximately).
2.5. Urban Environment
The built environment plays a significant role in influencing active mobility to and from school (AMS). Generally, routes chosen for walking or cycling to school exhibit specific characteristics. For example, studies have shown that these routes have a high housing density [6]. However, it is important to note that in specific cases, such as Kolkata in India, children’s independent mobility increases in low-rise neighborhoods rather than mid-rise and high-rise areas [26].
Other characteristics commonly observed in routes favored for active mobility include areas with a low density of intersections [22], flat or gentle slopes, and high levels of walkability [6]. On the other hand, some studies have found that diverse land uses and recreational open spaces do not significantly influence the decision to engage in active mobility [19].
Inadequate infrastructure, such as the absence of bicycle lanes and sidewalks, has been identified as a determining factor for both schoolchildren and parents in their decisions to avoid or delay walking or cycling [10,17,27]. These deficiencies in infrastructure can create safety concerns and discourage active modes of transportation.
2.6. Socio-Economic Status
The socioeconomic levels of neighborhoods have been found to influence AMS in various studies. For example, research conducted by Mitra et al. [28] in Toronto, Canada, revealed a clear differentiation between high-income and low-income neighborhoods. In high-income neighborhoods, there was a lower prevalence of independent mobility among schoolchildren compared to low-income neighborhoods. Similar results were found in Spain, where Ruiz-Hermosa et al. [29] discovered that children from low to medium–low socioeconomic levels were more likely to engage in active commuting to school than children from higher socioeconomic levels. These findings suggest that children from disadvantaged backgrounds may rely more on active modes of transportation due to various factors, such as limited access to motorized transportation options or financial constraints. In the case of São Paulo, Brazil, Humberto et al. [12] demonstrated that children attending schools in poorer regions had no alternative but to rely on walking as their primary mode of transportation. These findings highlight the importance of considering different regions’ unique socioeconomic and cultural contexts when examining the relationship between socioeconomic levels and AMS.
2.7. Gender
Gender is a demographic factor that has been found to influence active mobility to and from school (AMS). The literature reviews have consistently shown that parents tend to be more overprotective of their daughters than of their sons [4,6,24].
This pattern holds even in diverse cultural contexts. In Australia, for instance, boys exhibit greater independence in their mobility to school, covering a wider territorial range. This increased independence allows them to be more exposed to the neighborhood environment, enabling them to navigate better and manage potential risks. This dynamic creates a reinforcing cycle, where boys’ greater autonomy and exposure to the neighborhood foster their ability to handle risks more effectively [30]. Similar findings have been reported in India, where Chaudhry and Elumalai [31] conducted a study on the mobility of students in Dhanbad City and found that most female students relied on passive transportation to and from school. This suggests that girls in this context may face additional barriers or constraints that limit their active mobility compared to their male counterparts.
2.8. Active Mobility to School in Latin America
Despite the increasing interest in promoting sustainable and safe active mobility to school for children, there is a significant lack of research on AMS in Latin America. This scarcity is significant, considering Latin America is the world’s most urbanized region, accommodating an astounding population of over 180 million school-attending children and adolescents [9]. Although there have been a handful of studies conducted in cities such as Riobamba, Ecuador [11], Valparaiso, Chile (Palma et al., 2020) [10], and São Paulo, Brazil [12], the representation of Latin American cities in the published research literature is far from proportionate.
In this context, our research aims to contribute to the knowledge of AMS in Latin America, focusing on several factors from the Socio-Ecological Model potentially related to children’s commuting to school in Cuenca and Ibarra (Ecuador).
3. Data and Methods
This study was conducted in six schools in Cuenca and Ibarra, two intermediate Andean cities in Ecuador. Following the Socio-Ecological Model (SEM) for children’s mobility [13], we focus on investigating factors from some of the dimensions of SEM that may be influencing active travel to school: (a) children’s characteristics, (b) household characteristics, including parent’s attitudes and perceptions towards mobility, and (c) urban environment characteristics on micro- and mesoscales.
To cover these factors, we used three instruments: (a) a questionnaire to collect information on parents’ perceptions of the mobility of their children to school, household characteristics, children’s gender and transportation mode; (b) a street audit to evaluate the built environment around schools on the microscale; and (c) a land-use density metric to characterize the school neighborhood on the mesoscale. Table 1 summarizes the instruments, dimensions, and variables for this study. A complete list of variables and an explanation of specific levels are included in the Supplementary Materials.
Details about the selection of schools and instruments are presented in the following subsections.
3.1. Study Area and Participants’ Selection
This study was conducted in two intermediate-sized cities in Ecuador Andean Region: Cuenca in the south and Ibarra in the north (Figure 2). The average daytime temperatures are 7–17 °C in Cuenca and 13–24 °C in Ibarra. The municipality of Cuenca has a population of approximately 630,000, including the rural areas, and Ibarra has about 220,000 [32]. Both cities have historic central districts with a high density and diversity of land uses where several primary schools are located.
Three schools in each city were selected for the study based on five criteria: (i) the schools were public since preliminary research revealed that AMS in private schools was negligible; (ii) the schools had morning schedules; (iii) the schools offered 7th grade classes (corresponding to 10–12 year-old kids); (iv) the schools had male and female students; and (v) the schools were all within the urban area, but in different urban patterns: (a) downtown area with a high density of population and buildings, and (b) urban area with a lower density outside the central district.
Following these criteria, the three schools selected in Cuenca were: Luis Cordero (downtown area, high density), Nicolás Sojos, and Isabel Moscoso (urban area, low density). In the case of Ibarra, the following schools were selected: Velasco Ibarra and Ana Luisa Leoro (downtown area, high density) and Agustín Cueva (urban area, low density) (Figure 1).
All parents of 7th grade students in the selected schools were invited to participate during an in-person meeting.
3.2. Perceptions Questionnaire
A questionnaire aimed at parents of 7th grade students was developed to explore their perceptions and attitudes towards the mobility of their children to and from school. This instrument was based on the ‘Family Survey Questionnaire’ of the PACO project (Pedalea y Anda al COle) developed by the PROFITH research group of the University of Granada (https://profith.ugr.es/paco, accessed on 1 March 2024) [33]. The instrument followed a cross-cultural adaptation and validation process [34] to adjust for terminology, socioeconomic ranges, and relevant urban features for Ecuador. A group of experts reviewed the topics and questions, and pilot tests were conducted to check for clarity [35]. The survey and the application protocols used in the study reported here were approved by the Bioethics Committee of Universidad San Francisco de Quito (approbation number P2019-198E).
The questionnaire was composed of the following sections: (a) home–school travel mode, time and distance, companion (accompanied, alone); (b) barriers towards AMS; (c) perceptions of the school neighborhood; (d) knowledge about the benefits of active mobility; and (e) household socioeconomic characteristics. The complete questionnaire is provided as Supplementary Material.
The research team applied the instrument during meetings organized by each school with the parents of 7th grade students. First, the researchers explained the main aspects and goals of the project and the informed consent. Then, the parents who agreed to participate were asked to sign the informed consent and fill out printed forms containing the survey. Research assistants helped parents who required help with reading or filling out the questionnaires or clarifying any questions. Completing the survey took 20 min on average. The support of the schools’ authorities, teachers, and parents was essential for the success of this research. The surveys were digitized using Kobo Toolbox [36].
The survey data were preprocessed in R to code the variables as factors and levels. Also, a dichotomic variable, ‘AMS’ (active mobility to school), was constructed to represent if the children walked or cycled at least some part of their trip to or from school. Finally, the processed dataset was anonymized and stored in a .csv file (See Supplementary Materials).
3.3. Urban Environment Characteristics at the Micro-Scale
We used the eMAPS.ec instrument to evaluate the built environment around the schools at the microscale level [37]. This instrument was developed by the LlactaLAB Research Group at the University of Cuenca, as an adaptation of the MAPS instrument [38] for Ecuadorian cities. The original MAPS has been previously adapted and validated for different geographical contexts [39].
The eMAPS instrument enables the collection of comprehensive data for factors grouped into five “subdimensions” of the built environment at the street level: sidewalks, intersections, streetscape, aesthetics, and buildings. The tool was implemented as an open-source platform that includes a protocol for field data collection, a Kobo Toolbox project to deploy digital forms in mobile devices and aggregate them in a centralized server, and a QGIS v3.2 plugin to compute walkability scores from the collected data. Detailed documentation on all the variables and the source code is available at https://emaps.readthedocs.io/es/latest (accessed on 1 March 2024).
To define the street segments to evaluate, we employed spatial analysis techniques. Specifically, we first computed a five-minute walking isochrone from each school entrance using an instance of the OpenTripPlanner routing engine for the study areas available at http://llactalab.ucuenca.edu.ec/recursos (accessed on 1 March 2024). Next, we selected street segments from a GIS layer that overlapped at least 60% of their length with the computed isochrones. This process allowed us to accurately define the street segments to be evaluated in the study.
The data were collected in February 2020 by architecture students who underwent training in the protocol and tool and passed a user test with a minimum score of 80%. Unfortunately, due to the COVID-19 pandemic, we could not assess one school (Agustín Cueva in Ibarra). After collecting the data, we processed it using the eMAPS plugin for QGIS. The resulting scores for the five dimensions and the synthetic general walkability score were then stored in .csv tables and are provided as Supplementary Materials.
3.4. Urban Environment Characteristics at the Mesoscale
Due to the scarcity of detailed information on land uses in Ecuadorian cities, we developed a technique to compute two land use metrics (density and diversity) utilizing Google’s Places API to characterize the land use of each neighborhood around the schools. The Places API provides an interface to Google Maps, enabling users to retrieve points of interest (POIs) around a specific location [40]. However, the API imposes a hard limit of 60 retrieved POIs for each location, which are ordered by distance, and retrieving further points is impossible. Nevertheless, it is possible to analyze the spatial dispersion of the retrieved points to estimate the land use metrics.
To compute the land use density for each school, we first obtained a “footprint” of the closest 60 points retrieved with the Places API. We achieved this by computing a concave hull using the concaveman() function from the concaveman package in the software R [41]. Then, we divided the number of points by the area of the concave hull to obtain the land use density. The rationale for this process is that the footprint area increases as the density decreases (Figure 3). Finally, to estimate the land use diversity, we computed Shannon’s diversity index for the 60 points of interest around each school using the diversity() function of the vegan package in R [42]. This approach can be replicated in any urban area with coverage of Google Maps. The code in R for retrieving the POIs and computing the land use metrics is provided as Supplementary Materials.
3.5. Data Analysis
The analysis comprised three phases. First, all variables were examined through exploratory data analysis and summary statistics to provide a general overview of the travel behavior to school and each factor of the SEM. Then, the associations between children’s active mobility to school (AMS) and each factor from the distinct levels were analyzed using the Chi-squared test of independence. Finally, factors with significant association with AMS were further investigated with mosaic plots [43]. All analyses were conducted in R Software v 4.0 [44]. The code for the analysis and the data is available as Supplementary Materials.
4. Results
The survey was completed by parents of 334 7th grade children (10–12 years old), 156 in Cuenca (46.7%), and 178 in Ibarra (53.3%). This section first presents the descriptive statistics of variables related to each level of the SEM model, constituting the first published data on active mobility to school for the study area. Then, it presents the association levels for each variable with AMS. Finally, it presents the results of the modeling process.
4.1. Travel Behavior to School
Public transport and walking are the preferred modes for school travel, followed by private car (Table 2), although there are some essential differences between cities and directions, i.e., going to school or coming back home. In Cuenca, walking was the most used mode for traveling to and from school (36.5% and 44.2%, respectively), whereas in Ibarra, a public bus accounts for 54% in both directions. Taking both cities, it was more common for parents to drive their children to school (22.5%) than to drive them back home (15.9%). This difference translated into an increased rate of active travel home from school. These differences were significant under McNemar’s chi-squared test (p < 0.001). Only 20% of children from Cuenca traveled by themselves to school, whereas in Ibarra, the value was 38%. It was more common in both cities to travel back from school to home by themselves (p < 0.001).
Active mobility to school (AMS) varied among schools and between cities. Approximately 47% of children in Cuenca and 26% in Ibarra used an active mode at least some part of the round trip. Cycling, however, was negligible since only two parents in Cuenca, from the whole sample, stated their children pedal their bikes to or from school. Therefore, walking and cycling were grouped for the rest of the analysis.
These results show that travel behavior from home to school and school to home can differ, with more prevalence of active and independent mobility in the way back home.
4.2. Children and Household Characteristics
Of those who reported their children’s gender, 42.5% were female, and 11% reported some disability. Socioeconomic characteristics had more considerable variability between schools than between cities, with slightly higher values for Cuenca (Table 3). The travel time to school was relatively short in both cities. Almost 60% of children in Cuenca and nearly 50% in Ibarra reached school within fifteen minutes or less, and only 9% in Cuenca and 16% in Ibarra traveled more than 30 min (Figure 4). The association between the city and a maximum travel time of fifteen minutes was significant under a conditional independence test (p-value = 0.046).
These data reveal some essential aspects of the mobility of children attending the schools in this study. First, travel modes are diverse and include a predominance of walking and using buses, whereas only about one-fifth of children travel in private vehicles. Travel times were relatively short and convenient for active mobility. Finally, the differences in travel company for trips between children going to school and the same children going home from school revealed that parents’ convenience, related to schedules, might be a key factor for children’s independent mobility.
4.3. Parent’s Perceptions towards AMS
Many parents agreed with the health and environmental benefits of active mobility for children; however, Cuenca had a higher agreement rate than Ibarra. The intercity difference reflects less awareness of the benefits of active mobility by parents in Ibarra, where there was also a higher number of unanswered questions (Figure 5).
Parents’ main concerns regarding their children walking or cycling to school were related to road safety and personal security in both cities (Figure 6). More than 75% of parents worried about unsafe intersections and crossings, potential violence, lack of police presence, and the number and speed of vehicles. In most cases, time, distance, and lack of adequate infrastructure were also important. Other aspects of less concern included the presence of other adults and children cycling and walking. Parents were less worried about the weather or the enjoyment or boredom of walking and cycling. In general, levels of concern were slightly higher in Ibarra, but the differences from Cuenca were minimal.
Most parents would allow their children to walk or cycle to school if streets’ safety and security conditions were improved (Figure 7). Better walking and cycling infrastructure, less crime, more people walking, and safer intersections would encourage active mobility. Interestingly, improvements would have more of an impact on parents from Cuenca (mean = 66%) than from Ibarra (mean = 53%). Nevertheless, parents from Agustín Cueva school in Ibarra are the most sensitive to those improvements, since 74% of them would allow their children to walk or cycle if the streets were in better condition.
In general, we found that most parents are aware of the benefits of AMS but are worried about the urban environment conditions for walking and cycling. If those conditions improve, parents would consider allowing their children to travel to school actively.
The reasons for traveling in each mode vary across cities (Figure 8). The only general consistency is “distance” as the main reason for walking or cycling for all schools. Personal security was a reason for traveling in private vehicle in both cities. The cost had relatively low importance. Health and social relations were the least mentioned reasons for all modes.
4.4. Urban Environment Characteristics
Table 4 summarizes the variables of the urban environment around the schools. Higher values of population and land use densities characterize central zones. Therefore, these zones are expected to be livelier and more vibrant as more people move around. Nevertheless, land use diversity is not necessarily higher in those areas.
Walkability scores from eMAPS present some variation among schools, but values are low across all subdimensions, especially for “intersections”, “sidewalks”, and “streetscape”. Therefore, the microscale characteristics of the urban environment around the schools might hinder active mobility, especially for children.
4.5. Factors Associated with AMS
The associations between AMS and each factor are reported in Table 5. All factors were recodified to binary to produce balanced contingency tables. Categorical variables were coerced to two levels, and continuous variables from the urban environment were categorized according to their mean.
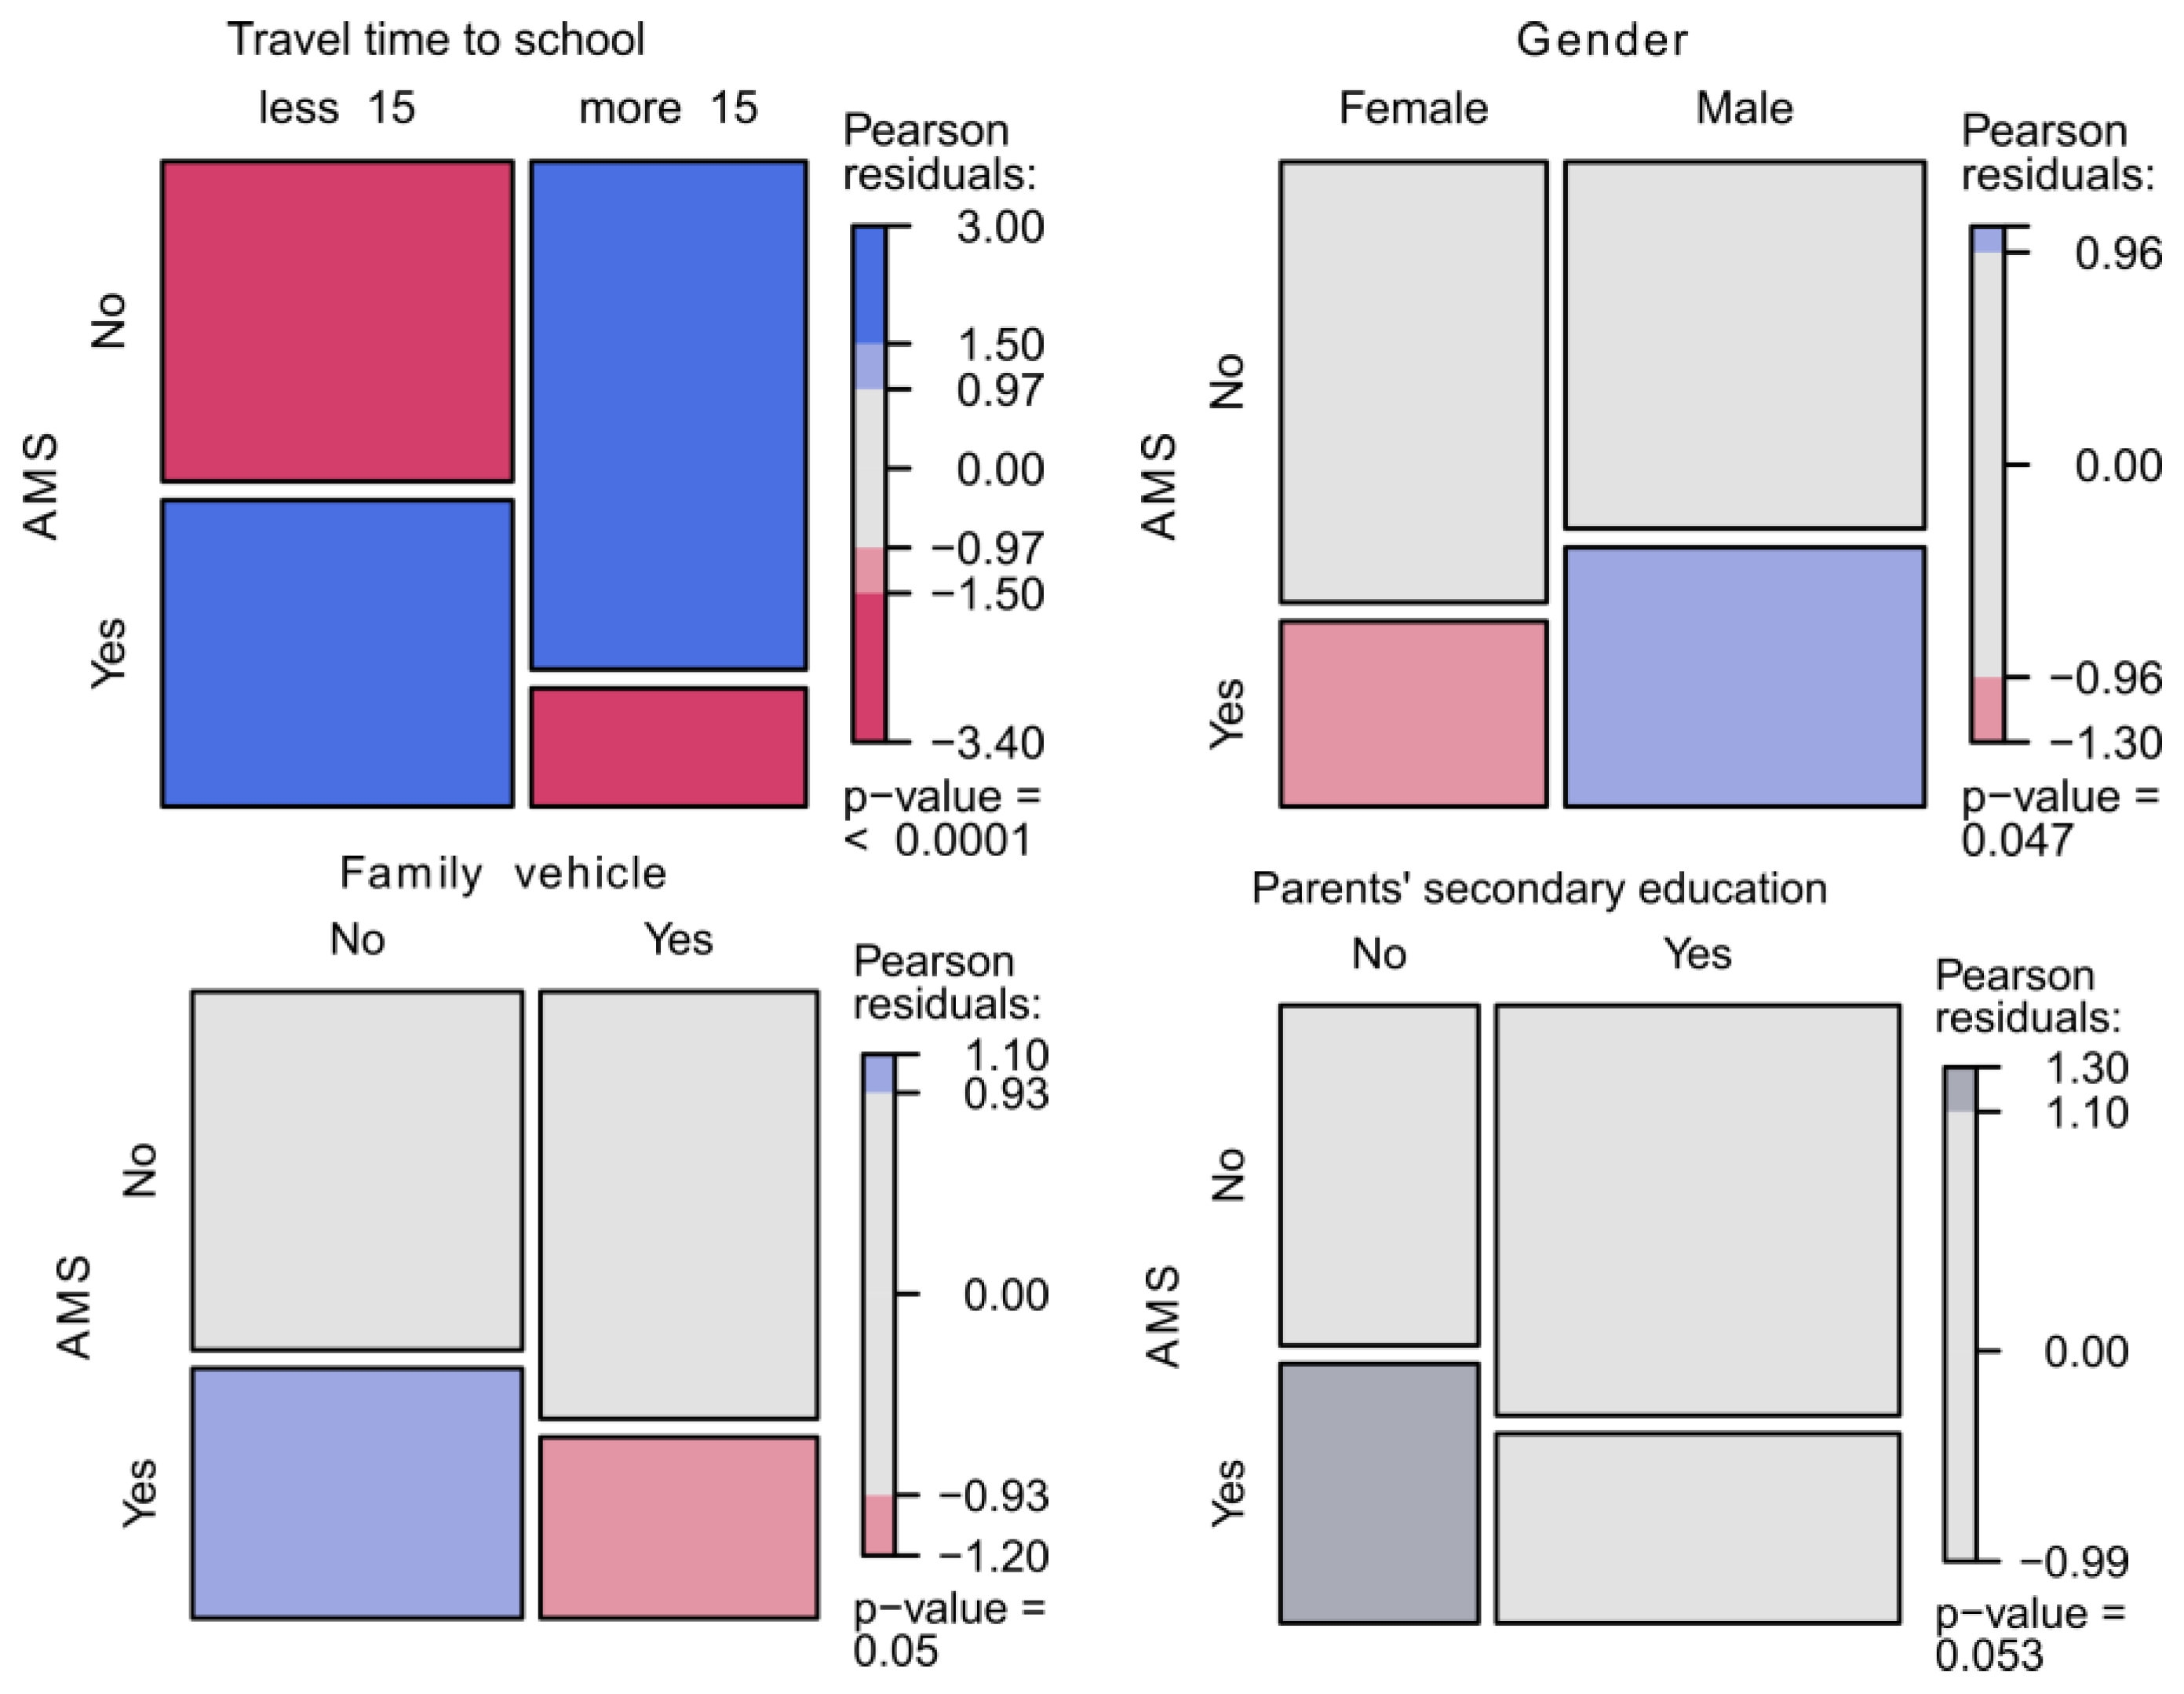
Those factors with statistical significance are further explored in mosaic plots to examine the specific levels and direction of the association. A mosaic plot is a tiled visualization of a contingency table of expected frequencies where the area of each tile is proportional to the corresponding cell entry frequency [43], providing a straightforward indication of the behavior of the data. Additionally, the visualization displays the fit of a log-linear model by assigning shades to Pearson’s residuals on the corresponding cell. Blue shades represent significant positive association, whereas red shades represent significant negative associations, and the color saturation indicates the significance level of the correlation. Gray implies that the association is non-significant. p-values for Pearson’s residuals from the linear-log model are also reported. Mosaic plots have been proved to be useful tools for exploring and interpreting association between categorical values [45].
Several factors from the individual and household level were associated with active mobility to school (Figure 9). As expected, proximity to the school (less than 15 min) was strongly associated with AMS, and living far from school (more than 15 min) was positively associated with motorized mobility. The inverse (negative) associations were also significant. Regarding gender, being male was positively associated with AMS, and being female was negatively associated. Having a family vehicle was negatively associated with AMS, whereas not having one was positively associated, although the association was on the limit of significance. Also, association was found between parents without complete secondary education and AMS. There was no evidence of a significant association between AMS and household income and disability.
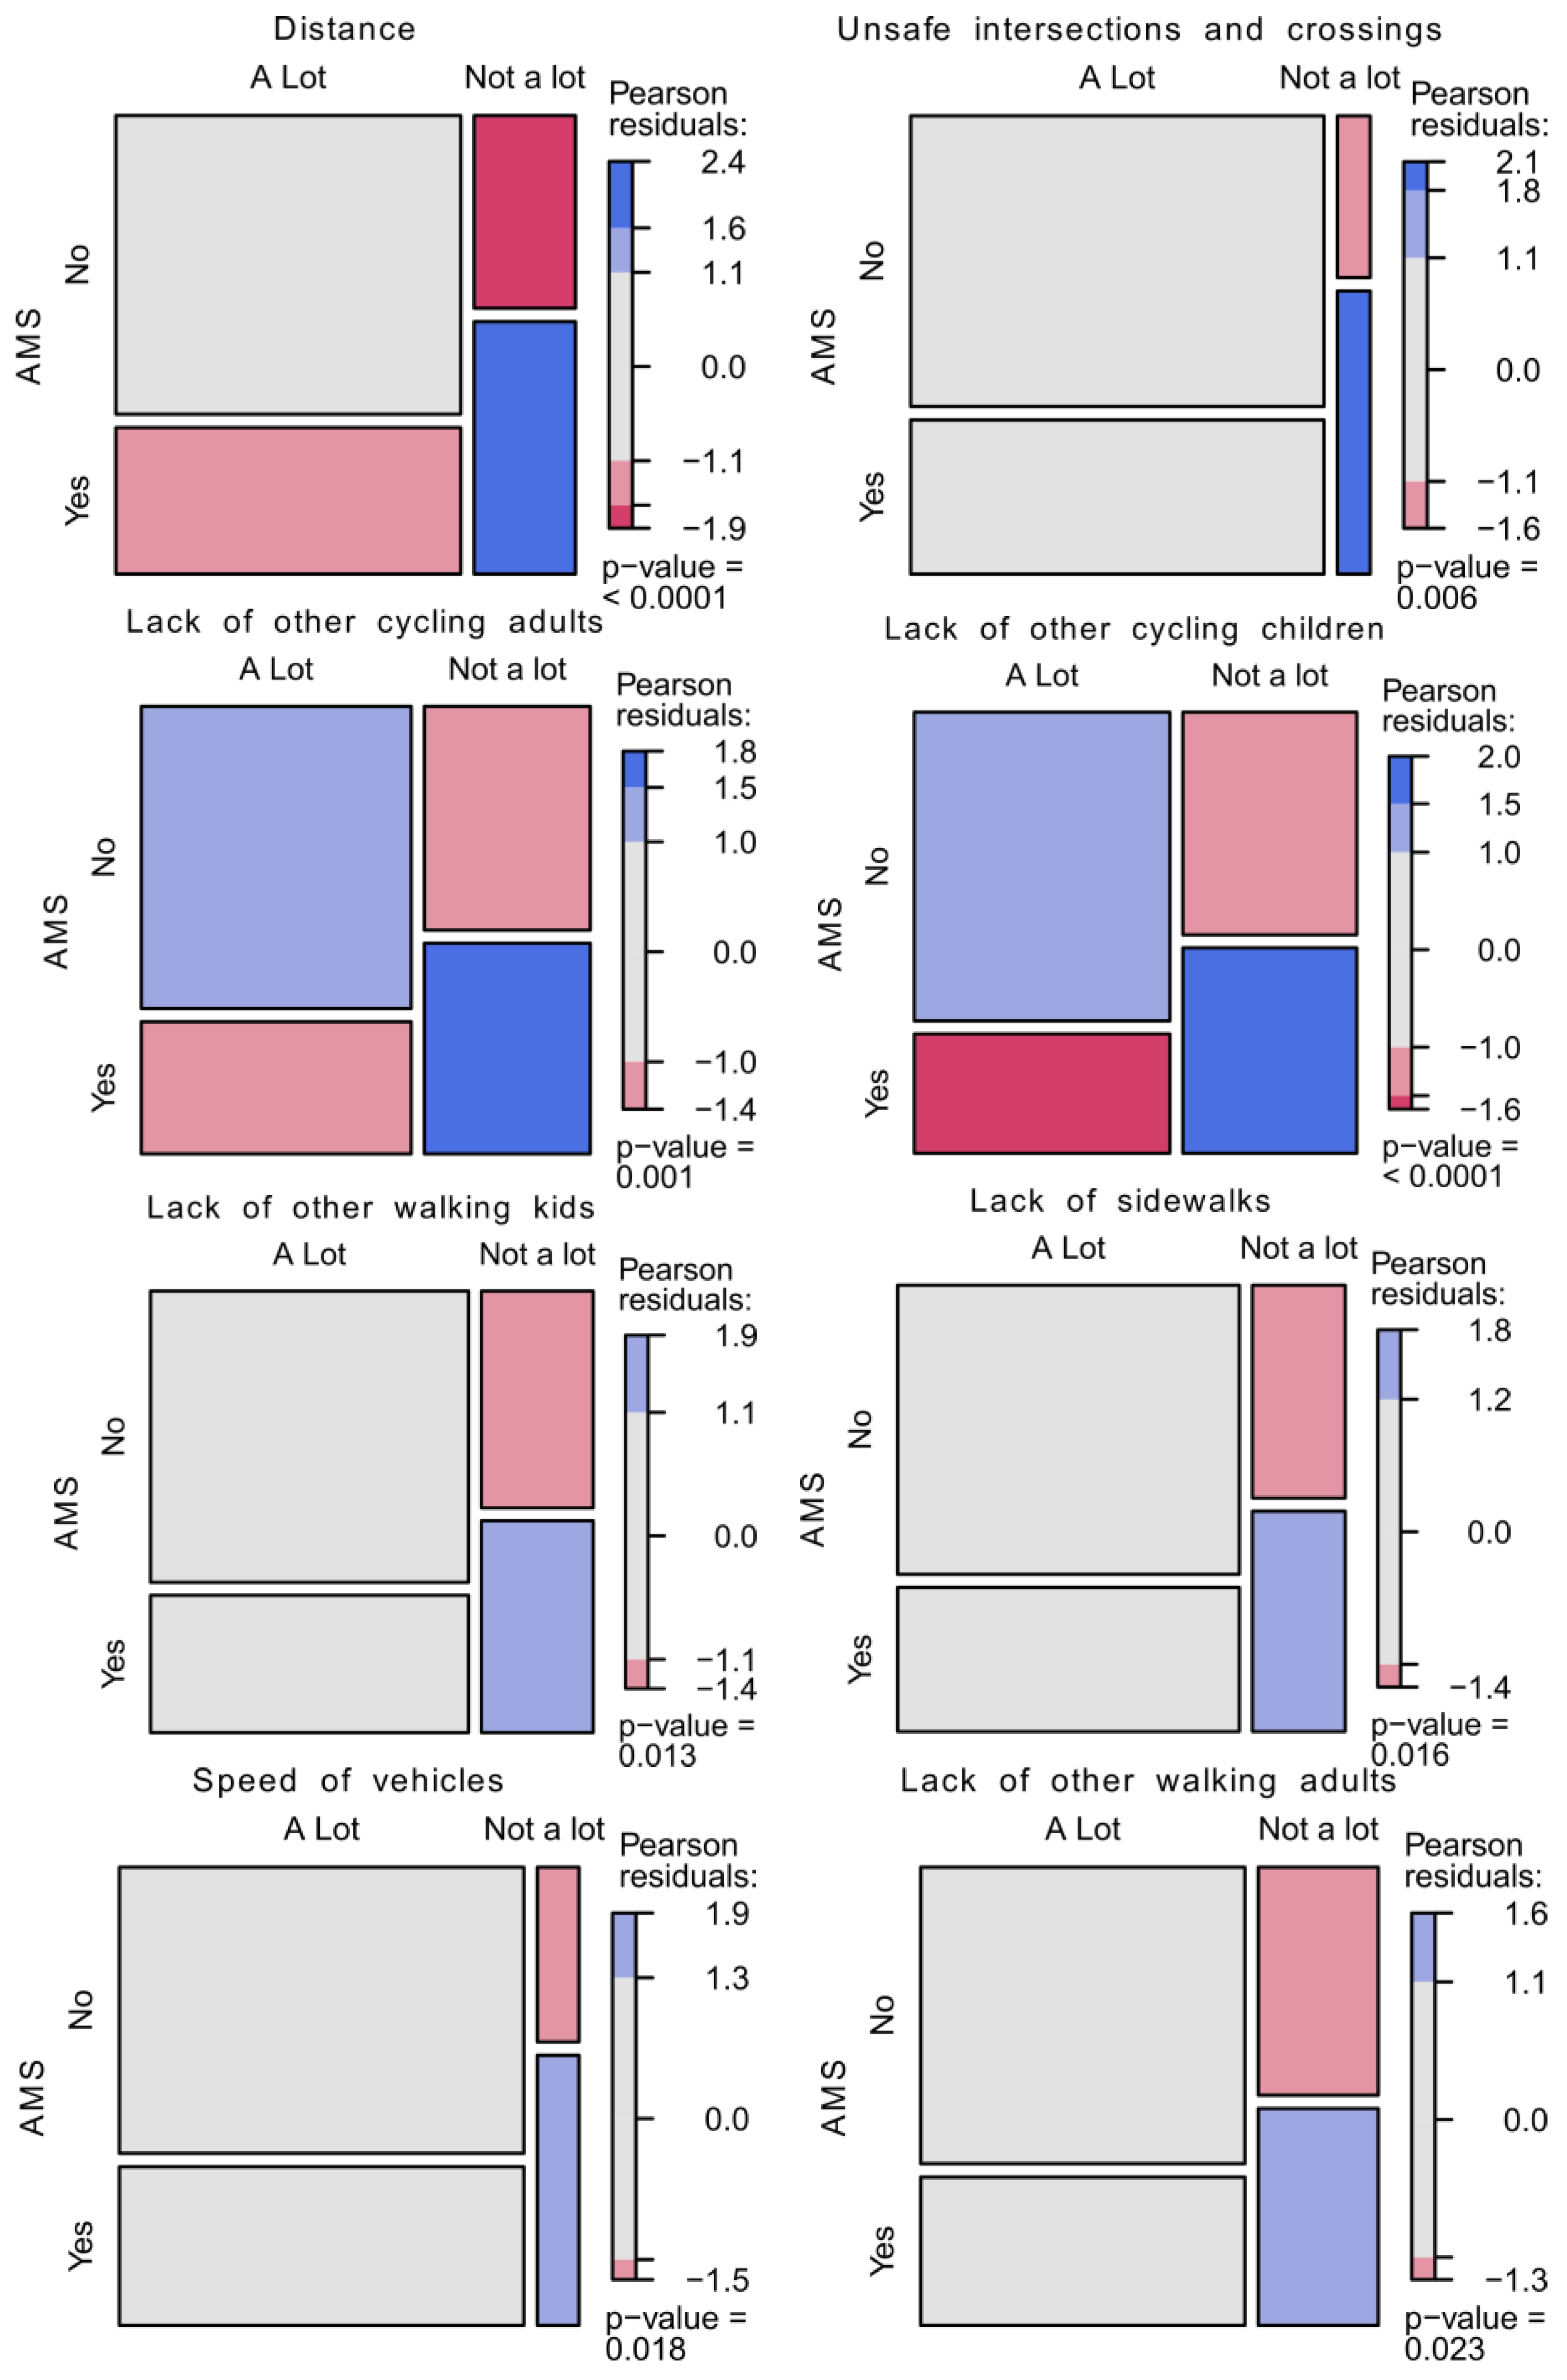
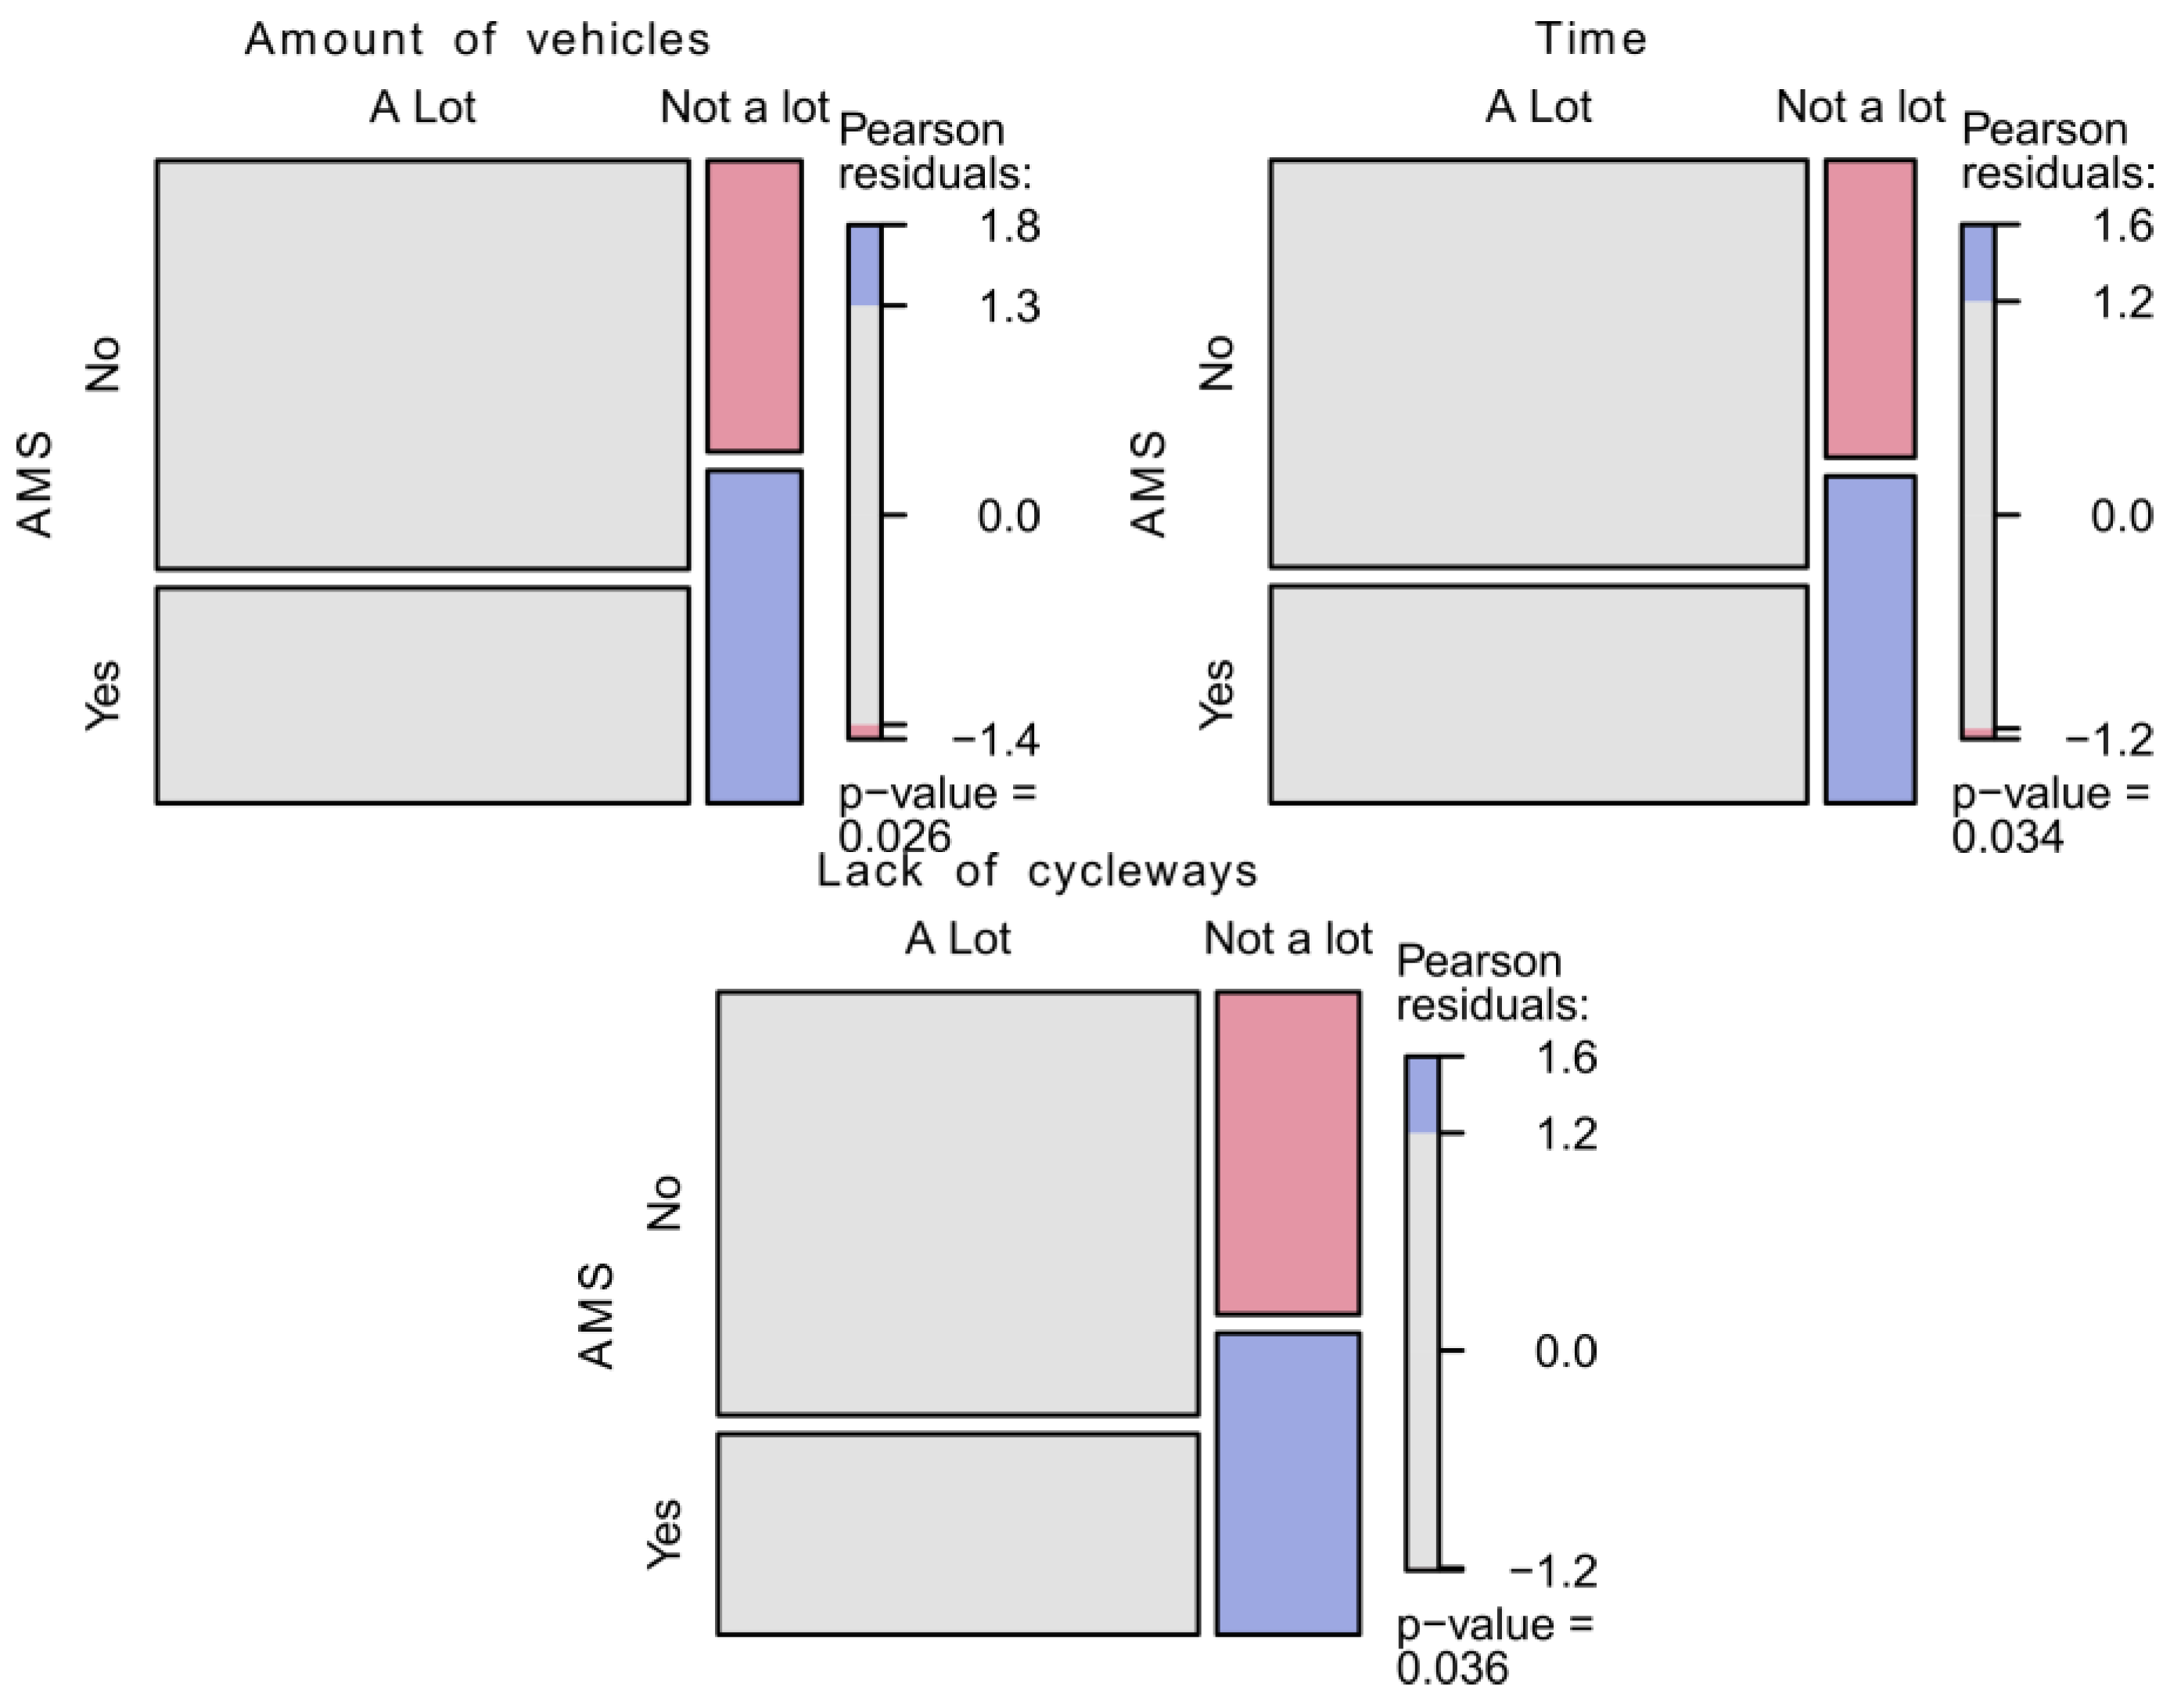
We found evidence of an association between active mobility to school and parents’ concern regarding various characteristics of the social and physical urban environment around schools (Figure 10). The aspects that where associated with AMS include distance and time from home to school, speed and volume of motorized vehicles, walking infrastructure, and the social environment, represented by other people walking or cycling. It is worth noting that although most parents are concerned about safety and violence, those concerns were not associated with AMS.
While causality cannot be inferred from these findings, it is evident that parents of children who walk or cycle to school express fewer concerns about the urban environment. We found no evidence of an association between AMS and parents’ agreement with the benefits of walking.
Regarding the microscale, a high walkability score from eMAPS was associated with AMS (Figure 11). This result shows that the eMAPS instrument captures the street-level features of the urban environment associated with walking to school. This also confirms that a walkable environment around the school plays an important role in promoting AMS, confirming previous results [38].
Among the urban characteristics at the mesoscale, only land use density showed a significant association with active mobility to school (AMS). However, the direction of this association contradicts what is commonly reported in the literature. In this study, low land use densities were found to be positively associated with active mobility, while high land use densities were associated with motorized mobility. Also, population density showed no association with AMS. This unexpected result may be attributed to the context of the studied cities, where traditional schools in central areas often attract considerable demand from families residing far away. In fact, a significant association (p < 0.0001) was observed between high land use density and travel time to school exceeding 15 min.
Finally, the city of Cuenca was positively associated with AMS, and Ibarra was negatively associated, which confirms the higher levels of walking to school in Cuenca compared to Ibarra. Figure 12 shows the mosaic plots for these factors.
5. Discussion
The findings from this study revealed that a significant proportion of children (27–34%) actively travel from home to school or vice versa, despite facing challenges resulting from unfavorable urban conditions and parental perceptions. It is worth noting that our study focused specifically on public schools, which are primarily attended by children from low- and middle-income households. This observation raises important questions regarding the inequalities within Latin American cities, where disadvantaged children may be compelled to walk despite unfavorable conditions. These findings support previous research conducted in Brazil and Spain [12,29], emphasizing the need for further investigation in this crucial area. Additionally, this study highlighted the limited use of bicycles for school commuting. This finding emphasizes the need for discussions and reflections on the reasons behind this low bicycle usage and the potential for promoting cycling as a viable mode of AMS.
Our results confirm that boys are more likely to engage in active transportation to school compared to girls, as has been found in other studies [4,6]. The literature has evidenced that gender is one of the personal attributes that influence the appropriation and safety perception of public spaces, this fact produces disparities in its use [46,47], due to sexual harassment [48,49] and violence [50]. These potential risks may influence parent’s decisions about mobility to school inhibiting active mobility; particularly in regions such as South America, where a deterioration in peacefulness has been occurring since several years ago [51].
While no significant association was found between disability and travel mode, it is important to acknowledge that the diversity of disabilities included in the sample may have posed various limitations to mobility, which could have influenced the results. Further research is warranted to explore this aspect in greater detail.
Household characteristics played a crucial role in determining children’s AMS. Specifically, children from households with cars and parents lacking secondary education were less likely to engage in walking. Among the household-level factors, proximity, measured as travel time to school, emerged as the most significant factor associated with AMS. We found no significant association between household income and AMS, but it should be noted that there was relatively low variability in the dataset; in fact, there were very few data points in the high-income group, so it was merged with the mid-income group in the study design.
While parents’ perceptions about children’s mobility varied among schools, important trends were observed. Parents demonstrated awareness of the benefits associated with active mobility and acknowledged the potential for increasing active mobility to school if certain conditions were improved. Distance, inadequate infrastructure, and personal safety emerged as the primary concerns toward active mobility, which aligns with previous studies [10,18,20,21]. Interestingly, we found that parents of children who actively travel are less concerned about these conditions compared to parents of children who use motorized modes of transportation. Weather conditions and boredom were not perceived as significant obstacles. These findings highlight the context-specific nature of active mobility to school and emphasize the influence of socioeconomic factors, climatic conditions, local regulations, and other complex issues. Therefore, comprehensive research, such as the study presented here, is crucial for addressing active mobility to school in a holistic manner.
The urban environment was found to have a significant influence on the levels of active mobility to school (AMS). Our findings indicated that children were more likely to walk to schools located in areas with favorable street-level characteristics, as reflected by the higher walkability scores obtained from eMAPS.
However, we observed an unexpected result at the meso-scale level, whereby schools situated in areas with lower land use density exhibited higher levels of AMS. It is important to note that this result is not unique to our study, as previous research has also found similar patterns. Although urban density has been largely recognized as one of the main factors affecting mode of transport [52], the relationship might be non-linear and nuanced for different urban settings. For example, Kyttä et al. [53] have found that moderate urban density is positively correlated with children’s active travel, whereas high-density areas in urban cores are not. Tyagi and Raheja [26] found higher AMS levels in low-rise areas, while Buliung et al. [19] did not observe a significant relationship between land use and AMS. Previous research in Latin American cities such as Bogotá (Colombia) and Cuenca (Ecuador) have found no significant association between urban density and active mobility after controlling other variables [54,55].
These findings highlight the complex relationship between the urban environment and AMS. While street-level characteristics play a role in promoting active mobility, other factors at the mesoscale, such as land use density and population density, may have different effects. Further research is necessary to understand the underlying mechanisms and contextual factors contributing to this apparent discrepancy.
6. Conclusions
This study represents one of the first comprehensive investigations on active mobility to school (AMS) in Ecuadorian cities, specifically focusing on the cities of Cuenca and Ibarra. This research aimed to explore various factors associated with AMS among 10–12-year-old children attending public schools. Drawing from the Socio-Ecological Model framework, the study examined multiple levels of influence, including individual, household, parental, and urban environmental factors on both micro- and mesoscales. By taking a holistic approach, the study sought to provide valuable insights into the factors shaping children’s AMS in these specific contexts.
The study’s findings, along with the open access resources provided, contribute to the limited existing knowledge on AMS in Latin American cities. The methodology employed in this investigation offers a replicable framework for assessing factors within the Socio-Ecological Model applied to children’s mobility in Latin American cities. However, certain limitations should be acknowledged. The COVID-19 pandemic disrupted data collection in one school, prompting the development of an innovative technique using the Google Places API to compute land use density and diversity. The sample size cannot be considered as fully representative of the cities, but this is the first study providing descriptive data about children’s AMS in Ecuador and its association with different factors.
We found some unexpected results, including no evidence of association between AMS and some factors usually reported as influencing active mobility such as population density or household income. Nevertheless, it should be noted that, in statistical terms, this does not imply the inexistence of such association, but that the evidence is not enough to reject the null hypothesis of no association. Similarly, the unexpected lack of association between disability and AMS could be explained by the aggregation of all kinds of disabilities in a single category. New studies with larger sample sizes and a finer categorization may be necessary to further confirm these results.
Future studies also should consider expanding the age range of participants and including private schools to explore the role of socioeconomic disparities in AMS, as well as including other factors regarding urban form. Although the use of Google Places API to estimate urban parameters is promising, further refinement of the method and proper validation in different settings will be necessary to expand its use for urban studies. Moreover, further analysis using logistic regression and machine learning techniques will provide a better understanding of the combined impact of different factors on AMS. Finally, comparing results across regions with different weather conditions and urban sizes and typologies would provide further insights.
The study’s implications extend beyond academia, aiming to inform government officials and city planners about the factors influencing parents’ decisions regarding school commuting. Achieving successful urban planning and environmental sustainability necessitates a comprehensive understanding of these complex issues. By integrating scientific evidence, cities can create environments that promote and support AMS for children. Enhancing conditions for AMS requires increased public awareness and investment. Implementing strategies that combine educational programs, infrastructure improvements, and safety measures will be key in promoting children’s AMS and enhancing their long-term health and quality of life.
Overall, this study contributes valuable information to the field and serves as a steppingstone for future research and evidence-based policymaking in promoting active mobility to school in Ecuadorian cities and beyond.
Supplementary Materials
The following supporting information can be downloaded at: https://www.mdpi.com/article/10.3390/su16072745/s1, Code for analysis, Study dataset.
Author Contributions
Conceptualization, D.O., C.H. and A.Q.; methodology, D.O. and C.H.; formal analysis, D.O. and D.B.; data curation, D.O. and D.B.; validation, C.H., A.Q. and J.A.; investigation, D.O., C.H. and J.A.; writing—original draft, D.O., C.H. and A.Q.; writing—review and editing D.O. and C.H.; supervision, D.O., C.H. and A.Q.; funding acquisition, D.O., C.H. and J.A.; project administration, D.O., C.H., J.A. and A.Q.; visualization, D.O. and D.B. All authors have read and agreed to the published version of the manuscript.
Funding
This research was funded by Vicerrectorado de Investigación from University of Cuenca (Project 001-RES II-2022) and co-funded by University of Azuay (Project INV-PCAR-A001-CEPRA-XIII-2019-05). Original data collection was supported by CEDIA (Project CEPRA-XIII-2019-05).
Institutional Review Board Statement
The study was conducted in accordance with the Declaration of Helsinki and approved by Bioethics Committee of Universidad San Francisco de Quito (approbation number P2019-198E).
Informed Consent Statement
Informed consent was obtained from all subjects involved in the study.
Data Availability Statement
The dataset for this study is provided as Supplementary Materials.
Acknowledgments
The authors express their gratitude to the teachers, parents, and children from the schools that participated in the study.
Conflicts of Interest
The authors declare no conflicts of interest. The funders had no role in the design of the study; in the collection, analyses, or interpretation of data; in the writing of the manuscript; or in the decision to publish the results.
References
- Borgogni, A.; Agosti, V. Urban Outdoor Education as a Driver for Active Mobility in Children. J. Phys. Educ. Sport 2021, 21, 574–579. [Google Scholar]
- D’Haese, S.; Van Dyck, D.; De Bourdeaudhuij, I.; Deforche, B.; Cardon, G. The Association between the Parental Perception of the Physical Neighborhood Environment and Children’s Location-Specific Physical Activity. BMC Public Health 2015, 15, 565. [Google Scholar] [CrossRef] [PubMed]
- Ewing, R.; Cervero, R. “Does Compact Development Make People Drive Less?” The Answer Is Yes. J. Am. Plann. Assoc. 2017, 83, 19–25. [Google Scholar] [CrossRef]
- Marzi, I.; Demetriou, Y.; Reimers, A.K. Social and Physical Environmental Correlates of Independent Mobility in Children: A Systematic Review Taking Sex/Gender Differences into Account. Int. J. Health Geogr. 2018, 17, 24. [Google Scholar] [CrossRef]
- Larouche, R.; Saunders, T.J.; Faulkner, G.E.J.; Colley, R.; Tremblay, M. Associations between Active School Transport and Physical Activity, Body Composition, and Cardiovascular Fitness: A Systematic Review of 68 Studies. J. Phys. Act. Health 2014, 11, 206–227. [Google Scholar] [CrossRef] [PubMed]
- Davison, K.K.; Werder, J.L.; Lawson, C.T. Children’s Active Commuting to School: Current Knowledge and Future Directions. Prev. Chronic Dis. 2008, 5, A100. [Google Scholar] [PubMed]
- Rothman, L.; Macpherson, A.K.; Ross, T.; Buliung, R.N. The Decline in Active School Transportation (AST): A Systematic Review of the Factors Related to AST and Changes in School Transport over Time in North America. Prev. Med. 2018, 111, 314–322. [Google Scholar] [CrossRef] [PubMed]
- Kotoula, K.M.; Botzoris, G.; Ayfantopoulou, G.; Profillidis, V. Urban School Travel—Understanding the Critical Factors Affecting Parent’s Choices. Advances in Mobility-as-a-Service Systems. In Advances in Mobility-as-a-Service Systems; Springer: Cham, Switzerland, 2021; pp. 912–922. [Google Scholar]
- UNICEF. Children un Latin America and the Caribbean Overview 2019. Available online: https://www.unicef.org/lac/sites/unicef.org.lac/files/2019-08/20190725_CUADRIPTICO-LAC-INGLESHR.pdf (accessed on 1 January 2020).
- Palma, X.; Chillón, P.; Rodríguez-Rodríguez, F.; Barranco-Ruiz, Y.; Huertas-Delgado, F.J. Perceived Parental Barriers towards Active Commuting to School in Chilean Children and Adolescents of Valparaíso. Int. J. Sustain. Transp. 2019, 14, 525–532. [Google Scholar] [CrossRef]
- Huertas-Delgado, F.J.; Chillón, P.; Barranco-Ruiz, Y.; Herrador-Colmenero, M.; Rodríguez-Rodríguez, F.; Villa-González, E. Parental Perceived Barriers to Active Commuting to School in Ecuadorian Youth. J. Transp. Health 2018, 10, 290–296. [Google Scholar] [CrossRef]
- Humberto, M.; Pizzol, B.; Moura, F.; Giannotti, M.; de Lucca-Silveira, M.P. Investigating the Mobility Capabilities and Functionings in Accessing Schools Through Walking: A Quantitative Assessment of Public and Private Schools in São Paulo (Brazil). J. Hum. Dev. Capab. 2020, 21, 183–204. [Google Scholar] [CrossRef]
- Mitra, R.; Manaugh, K. Chapter Five—A Social-Ecological Conceptualization of Children’s Mobility. In Transport and Children’s Wellbeing; Waygood, E.O.D., Friman, M., Olsson, L.E., Mitra, R., Eds.; Elsevier: Amsterdam, The Netherlands, 2020; pp. 81–100. ISBN 9780128146941. [Google Scholar]
- Banerjee, T.; Uhm, J.; Bahl, D. Walking to School: The Experience of Children in Inner City Los Angeles and Implications for Policy. J. Plan. Educ. Res. 2014, 34, 123–140. [Google Scholar] [CrossRef]
- Joelsson, T. ‘So That We Don’t Spoil Them’: Understanding Children’s Everyday Mobility through Parents’ Affective Practices. Child. Geogr. 2019, 17, 591–602. [Google Scholar] [CrossRef]
- McDonald, N.C.; Aalborg, A.E. Why Parents Drive Children to School: Implications for Safe Routes to School Programs. J. Am. Plann. Assoc. 2009, 75, 331–342. [Google Scholar] [CrossRef]
- Wilson, K.; Clark, A.F.; Gilliland, J.A. Understanding Child and Parent Perceptions of Barriers Influencing Children’s Active School Travel. BMC Public Health 2018, 18, 1053. [Google Scholar] [CrossRef] [PubMed]
- Ferri-García, R.; Fernández-Luna, J.M.; Rodríguez-López, C.; Chillón, P. Data Mining Techniques to Analyze the Factors Influencing Active Commuting to School. Int. J. Sustain. Transp. 2020, 14, 308–323. [Google Scholar] [CrossRef]
- Buliung, R.N.; Larsen, K.; Faulkner, G.E.J.; Stone, M.R. The “Path” Not Taken: Exploring Structural Differences in Mapped-versus Shortest-Network-Path School Travel Routes. Am. J. Public Health 2013, 103, 1589–1596. [Google Scholar] [CrossRef] [PubMed]
- Huertas-Delgado, F.J.; Herrador-Colmenero, M.; Villa-González, E.; Aranda-Balboa, M.J.; Cáceres, M.V.; Mandic, S.; Chillón, P. Parental Perceptions of Barriers to Active Commuting to School in Spanish Children and Adolescents. Eur. J. Public Health 2017, 27, ckw249. [Google Scholar] [CrossRef] [PubMed]
- Ikeda, E.; Hinckson, E.; Witten, K.; Smith, M. Assessment of Direct and Indirect Associations between Children Active School Travel and Environmental, Household and Child Factors Using Structural Equation Modelling. Int. J. Behav. Nutr. Phys. Act. 2019, 16, 32. [Google Scholar] [CrossRef] [PubMed]
- Moran, M.R.; Rodríguez, D.A.; Corburn, J. Examining the Role of Trip Destination and Neighborhood Attributes in Shaping Environmental Influences on Children’s Route Choice. Transp. Res. Part D Transp. Environ. 2018, 65, 63–81. [Google Scholar] [CrossRef]
- Rojas Lopez, M.C.; Wong, Y.D. Children’s Active Trips to School: A Review and Analysis. Int. J. Urban Sustain. Dev. 2017, 9, 79–95. [Google Scholar] [CrossRef]
- Stewart, O.; Vernez Moudon, A.; Claybrooke, C. Common Ground: Eight Factors That Influence Walking and Biking to School. Transp. Policy 2012, 24, 240–248. [Google Scholar] [CrossRef]
- Rodríguez-López, C.; Salas-Fariña, Z.M.; Villa-González, E.; Borges-Cosic, M.; Herrador-Colmenero, M.; Medina-Casaubón, J.; Ortega, F.B.; Chillón, P. The Threshold Distance Associated with Walking from Home to School. Health Educ. Behav. 2017, 44, 857–866. [Google Scholar] [CrossRef] [PubMed]
- Tyagi, M.; Raheja, G. Children’s Independent Mobility Licence and Its Association with the Built and Social Environment: A Study across Neighbourhood Typologies in Kolkata. Child. Geogr. 2021, 19, 717–734. [Google Scholar] [CrossRef]
- Wridt, P. A Qualitative GIS Approach to Mapping Urban Neighborhoods with Children to Promote Physical Activity and Child-Friendly Community Planning. Environ. Plann. B Plann. Des. 2010, 37, 129–147. [Google Scholar] [CrossRef]
- Mitra, R.; Faulkner, G.E.J.; Buliung, R.N.; Stone, M.R. Do Parental Perceptions of the Neighbourhood Environment Influence Children’s Independent Mobility? Evidence from Toronto, Canada. Urban Stud. 2014, 51, 3401–3419. [Google Scholar] [CrossRef]
- Ruiz-Hermosa, A.; Martínez-Vizcaíno, V.; Solera-Martínez, M.; Martínez-Andrés, M.; García-Prieto, J.C.; Sánchez-López, M. Individual and Social Factors Associated with Active Commuting to School in 4-6 Years Old Spanish Children. Int. J. Environ. Health Res. 2021, 31, 237–247. [Google Scholar] [CrossRef] [PubMed]
- Villanueva, K.; Giles-Corti, B.; Bulsara, M.; Trapp, G.; Timperio, A.; McCormack, G.; Van Niel, K. Does the Walkability of Neighbourhoods Affect Children’s Independent Mobility, Independent of Parental, Socio-Cultural and Individual Factors? Child. Geogr. 2014, 12, 393–411. [Google Scholar] [CrossRef]
- Chaudhry, S.K.; Elumalai, S.P. Active and Passive Transport Choice Behavior for School Students and Their Exposure to Different Transportation Modes. Transp. Res. Procedia 2020, 48, 2916–2928. [Google Scholar] [CrossRef]
- INEC. Proyecciones Poblacionales 2010–2020. Available online: https://www.ecuadorencifras.gob.ec/proyecciones-poblacionales/ (accessed on 27 December 2020).
- Segura-Díaz, J.M.; Rojas-Jiménez, Á.; Barranco-Ruiz, Y.; Murillo-Pardo, B.; Saucedo-Araujo, R.G.; Aranda-Balboa, M.J.; Herrador-Colmenero, M.; Villa-González, E.; Chillón, P. Feasibility and Reliability of a Questionnaire to Assess the Mode, Frequency, Distance and Time of Commuting to and from School: The PACO Study. Int. J. Environ. Res. Public Health 2020, 17, 5039. [Google Scholar] [CrossRef] [PubMed]
- Mokkink, L.B.; Terwee, C.B.; Gibbons, E.; Stratford, P.W.; Alonso, J.; Patrick, D.L.; Knol, D.L.; Bouter, L.M.; de Vet, H.C.W. Inter-Rater Agreement and Reliability of the COSMIN (COnsensus-Based Standards for the Selection of Health Status Measurement Instruments) Checklist. BMC Med. Res. Methodol. 2010, 10, 82. [Google Scholar] [CrossRef] [PubMed]
- Kallio, H.; Pietilä, A.-M.; Johnson, M.; Kangasniemi, M. Systematic Methodological Review: Developing a Framework for a Qualitative Semi-Structured Interview Guide. J. Adv. Nurs. 2016, 72, 2954–2965. [Google Scholar] [CrossRef] [PubMed]
- Pham, P.; Vinick, P.; Kreutzer, T.; Dorey, A.; Milner, J.; Musaraj, P. KoBoToolbox. 2016. Available online: https://www.kobotoolbox.org/ (accessed on 1 March 2024).
- Orellana, D.; Quezada, A.; Andino, A.; Peralta, C. eMAPS.ec: Herramienta Para Evaluación a Microescala de Ambientes Peatonales (Adaptación a Ciudades Ecuatorianas); Universidad de Cuenca: Cuenca, Ecuador, 2019. [Google Scholar]
- Millstein, R.A.; Cain, K.L.; Sallis, J.F.; Conway, T.L.; Geremia, C.; Frank, L.D.; Chapman, J.; Van Dyck, D.; Dipzinski, L.R.; Kerr, J.; et al. Development, Scoring, and Reliability of the Microscale Audit of Pedestrian Streetscapes (MAPS). BMC Public Health 2013, 13, 403. [Google Scholar] [CrossRef] [PubMed]
- Cain, K.L.; Geremia, C.M.; Conway, T.L.; Frank, L.D.; Chapman, J.E.; Fox, E.H.; Timperio, A.; Veitch, J.; Van Dyck, D.; Verhoeven, H.; et al. Development and Reliability of a Streetscape Observation Instrument for International Use: MAPS-Global. Int. J. Behav. Nutr. Phys. Act. 2018, 15, 19. [Google Scholar] [CrossRef] [PubMed]
- Google. Google Places API. Available online: https://developers.google.com/maps/documentation/places/web-service/search?hl=en (accessed on 4 April 2023).
- Gombin, J.; Vaidyanathan, R.; Agafonkin, V. Concaveman: A Very Fast 2D Concave Hull Algorithm. 2020. Available online: https://cran.r-project.org/web/packages/concaveman/concaveman.pdf (accessed on 1 March 2024).
- Oksanen, J.; Simpson, G.L.; Blanchet, F.G.; Kindt, R.; Legendre, P.; Minchin, P.R.; O’Hara, R.B.; Solymos, P.; Stevens, M.H.H.; Szoecs, E.; et al. Vegan: Community Ecology Package. 2022. Available online: https://cran.r-project.org/web/packages/vegan/vegan.pdf (accessed on 1 March 2024).
- Meyer, D.; Zeileis, A.; Hornik, K. The Strucplot Framework: Visualizing Multi-Way Contingency Tables with Vcd. J. Stat. Softw. 2007, 17, 1–48. [Google Scholar] [CrossRef]
- R Core Team. R: A Language and Environment for Statistical Computing; R Foundation for Statistical Computing: Vienna, Austria, 2016. [Google Scholar]
- Friendly, M. A Brief History of the Mosaic Display. J. Comput. Graph. Stat. 2002, 11, 89–107. [Google Scholar] [CrossRef]
- Medina, A.C.R.; Couto, A.C.P.; Machado, C.S.; Nogueira, C.S.S.; Moreira, J.V.F.; Marivoet, S. Concepts, Spaces, and Leisure Practices from the Perspective of Youth. Mot. Rev. Educ. Fis. 2022, 28, e10220014721. [Google Scholar] [CrossRef]
- Park, Y.; Garcia, M. Pedestrian Safety Perception and Urban Street Settings. Int. J. Sustain. Transp. 2020, 14, 860–871. [Google Scholar] [CrossRef]
- Gargiulo, I.; Garcia, X.; Benages-Albert, M.; Martinez, J.; Pfeffer, K.; Vall-Casas, P. Women’s Safety Perception Assessment in an Urban Stream Corridor: Developing a Safety Map Based on Qualitative GIS. Landsc. Urban Plan. 2020, 198, 103779. [Google Scholar] [CrossRef]
- Muğan, G. The Role of Space and Time Use Behaviors in Shaping the Incivility Experience of Young People. Megaron 2018, 13, 182–191. [Google Scholar] [CrossRef]
- Garfias Royo, M.; Parikh, P.; Walker, J.; Belur, J. The Response to Violence against Women and Fear of Violence and the Coping Strategies of Women in Corregidora, Mexico. Cities 2023, 132, 104113. [Google Scholar] [CrossRef]
- Institute for Economics and Peace. Global Peace Index 2023; Institute for Economics & Peace: Sydney, Australia, 2023; ISBN 9780645149494. [Google Scholar]
- Cervero, R.; Kockelman, K. Travel Demand and the 3Ds: Density, Diversity, and Design. Transp. Res. Part D Trans. Environ. 1997, 2, 199–219. [Google Scholar] [CrossRef]
- Kyttä, A.M.; Broberg, A.K.; Kahila, M.H. Urban Environment and Children’s Active Lifestyle: SoftGIS Revealing Children’s Behavioral Patterns and Meaningful Places. Am. J. Health Promot. 2012, 26, e137–e148. [Google Scholar] [CrossRef] [PubMed]
- Hermida, C.; Cordero, M.; Orellana, D. Analysis of the Influence of Urban Built Environment on Pedestrian Flow in an Intermediate-Sized City in the Andes of Ecuador. Int. J. Sustain. Transp. 2019, 13, 777–787. [Google Scholar] [CrossRef]
- Cervero, R.; Sarmiento, O.L.; Jacoby, E.; Gomez, L.F.; Neiman, A. Influences of Built Environments on Walking and Cycling: Lessons from Bogotá. Int. J. Sustain. Transp. 2009, 3, 203–226. [Google Scholar] [CrossRef]
Figure 1.
Socio-Ecological Model for children’s mobility with relevant dimensions. Adapted from [13].
Figure 1.
Socio-Ecological Model for children’s mobility with relevant dimensions. Adapted from [13].

Figure 2.
Reference maps. (a) location of the cities of Cuenca and Ibarra in Ecuador; (b) schools’ locations in Ibarra; and (c) schools’ locations in Cuenca.
Figure 2.
Reference maps. (a) location of the cities of Cuenca and Ibarra in Ecuador; (b) schools’ locations in Ibarra; and (c) schools’ locations in Cuenca.

Figure 3.
Example of concave hull footprints for two sets of 60 points to estimate land use density and diversity. Colors represent different land use categories. (A) area = 5.6 ha, density = 10.7 pts/ha. (B) area = 2.9 ha. density = 20.5 pts/ha.
Figure 3.
Example of concave hull footprints for two sets of 60 points to estimate land use density and diversity. Colors represent different land use categories. (A) area = 5.6 ha, density = 10.7 pts/ha. (B) area = 2.9 ha. density = 20.5 pts/ha.

Figure 4.
Travel time to school.

Figure 5.
Perceptions of benefits of active mobility for each school. IM: Isabel Moscoso, LC: Luis Cordero, NS: Nicolas Sojos, AC: Agustín Cueva, ALL: Ana Luisa Leoro, VI: Velasco Ibarra.
Figure 5.
Perceptions of benefits of active mobility for each school. IM: Isabel Moscoso, LC: Luis Cordero, NS: Nicolas Sojos, AC: Agustín Cueva, ALL: Ana Luisa Leoro, VI: Velasco Ibarra.

Figure 6.
Level of concern regarding walking or cycling. Values are in percentages for each factor. “General” represents all factors together.
Figure 6.
Level of concern regarding walking or cycling. Values are in percentages for each factor. “General” represents all factors together.

Figure 7.
Influence of improvements on parents’ predisposition to active mobility. These data are from the responses to the survey question: “Will you allow your children to walk or cycle to school if these conditions improve?” (N.A. means “No Answer”).
Figure 7.
Influence of improvements on parents’ predisposition to active mobility. These data are from the responses to the survey question: “Will you allow your children to walk or cycle to school if these conditions improve?” (N.A. means “No Answer”).

Figure 8.
Declared reasons for travel modes.

Figure 9.
Association between individual and household characteristics with AMS.

Figure 10.
Association between AMS and level of concern about the urban environment.


Figure 11.
Association between AMS and eMAPS walkability index.

Figure 12.
Association between AMS and urban characteristics.


Table 1.
Selected dimensions and subdimensions from the Socio-Ecological Model, variables, and instruments.
Table 1.
Selected dimensions and subdimensions from the Socio-Ecological Model, variables, and instruments.
| SEM Dimension | Subdimension | Variables (Levels or Values) | Instrument |
|---|---|---|---|
| Children | Children characteristics | Gender (male/female) | Parent’s questionary |
| Disability (yes/no) | |||
| Household | Household characteristics | Income (high and mid/low) | Parent’s questionary |
| Vehicle availability (yes/no) | |||
| Parent’s secondary level education (yes/no) | |||
| Proximity | Travel time in minutes (0–15/16–30/30–60/>60) | Parent’s questionary | |
| Attitudes and perceptions | Perceived benefit of AM (agree/disagree) | Parent’s questionary | |
| Barriers for AM (yes/no) | |||
| Facilitators of AM (yes/no) | |||
| Urban environment at microscale | Sidewalks, intersections, streetscape, aesthetics, buildings | eMAPS Category (high/low) | eMAPS * |
| Urban environment at mesoscale | Land use | Land use density (high/low) | Land use metrics |
| Land use diversity (high/low) | |||
| Population density (hab/ha) | |||
| Perceived social environment | Perceived social environment (high/mid/low) | Parent’s questionary | |
| Perceived physical environment | Perceived physical environment (high/mid/low) | Parent’s questionary | |
| Outcome | Travel behavior to school | Travel mode Active mobility to school (yes/no) Travel company | Parent’s questionary |
* The details of eMAPS walkability score and the complete list of variables are available on the eMAPS documentation.
Table 2.
Summary of results for travel behavior.
| Cuenca | Ibarra | Total | |||||||
|---|---|---|---|---|---|---|---|---|---|
| School * | IM | LC | NS | Sub Total | AC | AL | VI | Sub Total | |
| Travel mode: home to school | |||||||||
| Walk or cycle | 73.5% | 21.3% | 38.3% | 37.8% | 34.5% | 20.6% | 11.1% | 18.5% | 27.5% |
| Public bus | 20.6% | 25.3% | 14.9% | 21.2% | 51.7% | 44.1% | 63.0% | 53.9% | 38.6% |
| Private vehicle | 5.9% | 32.0% | 36.2% | 27.6% | 6.9% | 27.9% | 19.8% | 20.8% | 24.0% |
| School bus | 0.0% | 17.3% | 6.4% | 10.3% | 6.9% | 5.9% | 2.5% | 4.5% | 7.2% |
| Other/N.A. ** | 0.0% | 4.0% | 4.3% | 3.2% | 0.0% | 1.5% | 3.7% | 2.2% | 2.7% |
| Travel mode: School to home | |||||||||
| Walk or cycle | 73.5% | 28.0% | 51.1% | 44.9% | 41.4% | 22.1% | 21.0% | 24.7% | 34.1% |
| Public bus | 17.6% | 34.7% | 14.9% | 25.0% | 41.4% | 50.0% | 61.7% | 53.9% | 40.4% |
| Private vehicle | 5.9% | 18.7% | 25.5% | 17.9% | 6.9% | 22.1% | 12.3% | 15.2% | 16.5% |
| School bus | 0.0% | 18.7% | 6.4% | 10.9% | 10.3% | 4.4% | 1.2% | 3.9% | 7.2% |
| Other/N.A. ** | 2.9% | 0.0% | 2.1% | 1.3% | 0.0% | 1.5% | 3.7% | 2.2% | 1.8% |
| Active mobility to school (AMS) | |||||||||
| Yes | 76.5% | 29.3% | 53.2% | 46.8% | 41.4% | 25.0% | 21.0% | 25.8% | 35.6% |
| Travel by themselves to school | |||||||||
| Yes | 26.5% | 16.0% | 21.3% | 19.9% | 41.4% | 32.4% | 42.0% | 38.2% | 29.6% |
| Travel by themselves back to home | |||||||||
| Yes | 38.2% | 33.3% | 34.0% | 34.6% | 37.9% | 38.2% | 55.6% | 46.1% | 40.7% |
* IM: Isabel Moscoso, LC: Luis Cordero, NS: Nicolas Sojos, AC: Agustín Cueva, AL: Ana Luisa Leoro, VI: Velasco Ibarra. ** “Other” and “No Answer” (N.A.) were grouped.
Table 3.
Summary of household variables.
| City | Cuenca | Ibarra | Total | ||||||
|---|---|---|---|---|---|---|---|---|---|
| School ** | IM | LC | NS | Sub Total | AC | AL | VI | Sub Total | |
| Zone *** | Per | Cen | Per | Per | Cen | Cen | |||
| n | 34 | 75 | 47 | 156 | 29 | 68 | 81 | 178 | 334 |
| % of sample | 10.2% | 22.5% | 14.1% | 46.7% | 8.7% | 20.4% | 24.3% | 53.3% | 100.0% |
| % Female | 41.9% | 31.9% | 59.5% | 42.3% | 44.8% | 46.3% | 39.1% | 42.8% | 42.5% |
| % Disability * | 8.8% | 21.3% | 6.4% | 14.1% | 9.9% | 5.9% | 10.3% | 8.4% | 11.1% |
| % Parents Sec. Edu. * | 58.8% | 75.3% | 63.6% | 68.2% | 40.7% | 74.2% | 68.4% | 66.1% | 67.1% |
| % Vehicle availability * | 38.2% | 50.7% | 50.0% | 47.7% | 37.9% | 53.6% | 38.4% | 43.7% | 45.6% |
| % Mid and high income * | 56.3% | 65.1% | 63.9% | 62.6% | 40.9% | 60.0% | 50.9% | 52.7% | 57.7% |
| % Less than 15 min * | 87.9% | 53.3% | 57.8% | 62.1% | 37.2% | 58.5% | 69.0% | 50.6% | 56.0% |
* Percents relative to each school, city, and total (computed excluding N.A.s). ** IM: Isabel Moscoso, LC: Luis Cordero, NS: Nicolas Sojos, AC: Agustín Cueva, AL: Ana Luisa Leoro, VI: Velasco Ibarra. *** Zones: Per = Peripherical, Cen = Central.
Table 4.
Urban environment characteristics around the schools.
| City | Cuenca | Ibarra | ||||
|---|---|---|---|---|---|---|
| School *** | IM | LC | NS | AC | AL | VI |
| Zone | Periph. | Central | Periph. | Periph. | Central | Central |
| Urban Environment Mesoscale | ||||||
| Land use density (places/ha) | 8.79 | 26.41 | 7.62 | 1.27 | 10.71 | 20.52 |
| Shannon Diversity | 4.013 | 3.623 | 3.795 | 3.547 | 4.069 | 3.721 |
| Pop. Density (hab/ha) | 47.59 | 89.12 | 66.62 | 26.82 | 52.51 | 60.82 |
| Urban Environment Microscale ** | ||||||
| eMAPS Score (Z) | 1.809 | 0.571 | −0.405 | NA * | −0.327 | −1.427 |
| eMAPS aesthetics | −0.008 | 0.114 | 0.241 | NA | 0.34 | 0.20 |
| eMAPS buildings | 0.364 | 0.300 | 0.366 | NA | 0.38 | 0.31 |
| eMAPS intersections | −0.197 | −0.117 | −0.054 | NA | −0.112 | −0.127 |
| eMAPS sidewalks | 0.102 | 0.087 | 0.062 | NA | 0.077 | 0.068 |
| eMAPS streetscape | 0.058 | 0.029 | 0.022 | NA | 0.108 | 0.066 |
* Due to the COVID-19 pandemic, it was impossible to collect eMAPS field data for Agustín Cueva school. ** eMAPS walkability score is represented as Z values to facilitate comparison. Other eMAPS subdimensions are represented in a relative score (−1:1). *** IM: Isabel Moscoso, LC: Luis Cordero, NS: Nicolas Sojos, AC: Agustín Cueva, AL: Ana Luisa Leoro, VI: Velasco Ibarra.
Table 5.
Association between AMS and factors from SEM.
| Dimension | Variable | Chi2 p-Value | |
|---|---|---|---|
| Individual | Gender | 0.043 | * |
| Disability | 0.709 | ||
| Household characteristics | Household income | 0.297 | |
| Vehicle availability | 0.045 | * | |
| Parent’s secondary-level education | 0.049 | * | |
| Travel time in minutes (<15 min, ≥15) | <0.0001 | *** | |
| Parents’ concerns | Distance | <0.001 | *** |
| Time | 0.038 | * | |
| Amount of vehicles | 0.014 | * | |
| Speed of vehicles | 0.015 | * | |
| Lack of sidewalks | 0.013 | * | |
| Unsafe intersections and crossings | 0.008 | ** | |
| Lack of cycleways | 0.034 | * | |
| Lack of bicycle parking | 0.150 | ||
| Violence | 0.289 | ||
| Lack of policemen | 0.075 | ||
| Lack of other walking adults | 0.001 | ** | |
| Lack of other walking kids | 0.010 | * | |
| Lack of other cycling adults | 0.002 | ** | |
| Lack of other cycling children | 0.003 | ** | |
| Walking is boring | 0.106 | ||
| Cycling is boring | 0.050 | ||
| Cold or hot weather | 0.615 | ||
| Rain | 0.518 | ||
| Backpack weight | 0.302 | ||
| Parents’ agreement with benefits | Improves academic performance | 0.740 | |
| Reduces cardiovascular risk | 0.105 | ||
| Prevents obesity | 0.484 | ||
| Reduces pollution | 0.598 | ||
| Reduces traffic | 0.764 | ||
| Urban Environment Mesoscale | Land use density | <0.001 | *** |
| Land use diversity | 0.101 | ||
| Population density | 0.070 | ||
| Urban Environment Mesoscale | eMAPS walkability | 0.019 | * |
Significance levels: *: <0.05, **: <0.01, ***: <0.001.
Disclaimer/Publisher’s Note: The statements, opinions and data contained in all publications are solely those of the individual author(s) and contributor(s) and not of MDPI and/or the editor(s). MDPI and/or the editor(s) disclaim responsibility for any injury to people or property resulting from any ideas, methods, instructions or products referred to in the content. |
© 2024 by the authors. Licensee MDPI, Basel, Switzerland. This article is an open access article distributed under the terms and conditions of the Creative Commons Attribution (CC BY) license (https://creativecommons.org/licenses/by/4.0/).
Share and Cite
MDPI and ACS Style
Orellana, D.; Hermida, C.; Quezada, A.; Andrade, J.; Ballari, D. Children’s Active Mobility to School: Evidence from Two Andean Cities. Sustainability 2024, 16, 2745. https://doi.org/10.3390/su16072745
AMA Style
Orellana D, Hermida C, Quezada A, Andrade J, Ballari D. Children’s Active Mobility to School: Evidence from Two Andean Cities. Sustainability. 2024; 16(7):2745. https://doi.org/10.3390/su16072745
Chicago/Turabian StyleOrellana, Daniel, Carla Hermida, Adriana Quezada, Jorge Andrade, and Daniela Ballari. 2024. "Children’s Active Mobility to School: Evidence from Two Andean Cities" Sustainability 16, no. 7: 2745. https://doi.org/10.3390/su16072745
Note that from the first issue of 2016, this journal uses article numbers instead of page numbers. See further details here.