Gantt chart. Visualize the Chronological Sequence of Tasks.
What is a Gantt chart? What advantages does it offer in project management and how can you create Gantt charts?
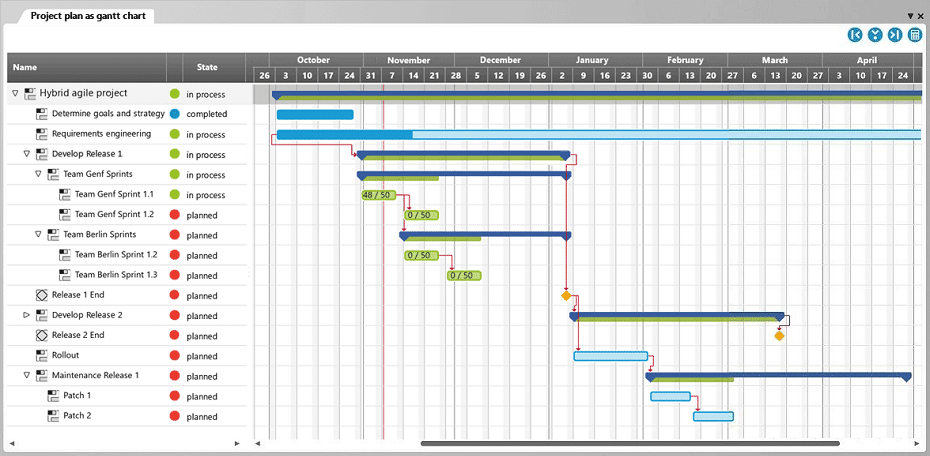
A Gantt chart is a tool in project management to present the sequence of activities on a time axis. The structure is always the same: on the left, you see the activities as a list and on the right next to it the presentation on the time axis.
The activities are visualized as bars on the time axis, that is why this diagram can also be called a bar diagram or a bar plan. The duration determines the length of the bars.
To define dependencies between activities, they are connected with a control flow. This is identified through an arrow in the diagram and says, for example, whether an activity can begin when the previous has finished.
What Does a Gantt Chart Have to Do with a Harmonogram?
The origin of the Gantt diagram or Gantt chart reaches back one hundred years. And it was in Poland: because there Karol Adamiecki, a Polish engineer, developed a diagram with bars so he could better plan his projects, around the year 1890. He named this idea the harmonogram or harmonograph. Unfortunately, he only published his work in Polish and Russian, so that the Western world hardly noticed. And so it happened that Henry Gantt, an American engineer, developed a similar concept about fifteen years later and brought the idea to the West. That is why this type of diagram is now known as a Gantt chart or a Gantt diagram.
What Is a Gantt chart?
A Gantt diagram or a Gantt chart is a tool in project management to present the sequence of activities on a time axis. Because these activities are visualized as bars, they are also called bar diagrams or bar plans.
With the help of the diagram, the process of the activities can be controlled and it can be quickly recognized how deviations and delays will affect the course of the project. A Gantt chart is generally developed based on the work breakdown structure.
Advantages of the Gantt Chart
- Established tool to keep teams and stakeholders in the loop.
- Quicker overview of project activities
- Duration of the activities is easy to recognize because of the length of the bars
- Relationships between the activities is easy to recognize because of the connection lines
- Current status in project is easily detectable
- Effort of creation and implementation is minimal
- Buffer times can be easily recognized
- Critical activities and critical paths are easily identified
A short and sweet definition of the Gantt chart:
A Gantt chart is a project management tool that presents the sequence of activities on a time axis.
How Is a Gantt Diagram Created?
A Gantt diagram or bar diagram is shared into two areas: on the left you can see the tasks of the project as a hierarchical list and next to it on the right the diagram with the bars.
Elements of the Gantt Chart
A Gantt diagram generally consists of the following elements:
Activities:
Activities or processes summarize work units like work packages. For example, in traditional projects there is an activity for the whole project and further activities for individual phases like planning and implementation. In an agile project, the Gantt diagram also begins with the project activity and the individual release and sprint activities are ordered underneath it.
Work packages:
Work packages are stand-alone tasks that have to be accomplished by a determined point in time with defined results and expenses. Work packages cannot be subdivided. Often a work package determines how long the activitis itself will last within an activitiy. That way the length of the bars of the activity are adjusted to appointment changes in the Gantt chart.
Milestones:
Milestones identify the end of a phase or level in a project. They therefore represent goals that have already been reached in the project or the ones that are being strived for. Milestones are specially identified in Gantt charts.
Read here to learn more about classical and hybrid project management »
Development of the Gantt Chart
A Gantt diagram or a bar diagram is based on a work breakdown structure that was created beforehand. In this plan the project is structured into tasks (Partial projects, partial tasks and work packages). Through this, it can be seen which tasks have to be managed. With the Gantt chart, the duration and the dependencies of the tasks can be planned.
To create a bar diagram for your project, carry out the following steps:
- Identify the tasks in the project (create a work breakdown structure)
- Determine the duration of the tasks
- Determine the relationships of the tasks to each other (define control flow)
Duration of the tasks and critical path
The duration of the activities and the work packages determine the length of the bars. The bars of individual tasks can overlap in Gantt charts. It is recommended to plan in buffer time between the tasks. If tasks can influence the end of the project and there is no buffer time between them, then a critical path holds sway here. Because if something is delayed here, then the completion of the project is delayed. You might already know this concept from precedence diagrams.
Create a Gantt chart
Easily with our Tool
Learn more about project management with objectiF RPM »
The Control Flow in the Gantt Chart
Many tasks can only be started after other ones are finished, or they are dependent on the beginning of another activity. These linear-proceeding relationships have to be presented on the Gantt chart or bar diagram. If tasks take place linearly, then there are four different relationship types:
End to end: A task can only finish when a previous task has finished.
Start to start: A task can only begin when the previous task has begun.
Start to finish: A task can only finish when the previous one has begun (very rare).
Of course, it is best when as many tasks as possible can run parallel to each other. Parallel-running tasks can be connected with control flows in the Gantt diagram.
Control your projects
A Gantt chart is a tried and tested means of control in project management – this diagram has, after all, existed already for over one hundred years and is still in frequent use. It is no wonder, because they are easy to create and offer a quick overview of the status of your projects. But do you want to draw the Gantt chart by hand as the inventors did? Use a tool that provides a template of the creation of bar diagrams and with which you can simply define the dependencies between the tasks. If you have to adapt the plan, you only need to move the corresponding activities or work packages in the Gantt diagram – the tool carries out all further calculations so that you can, for example, recognize critical paths straight away.